
Fig. 7.
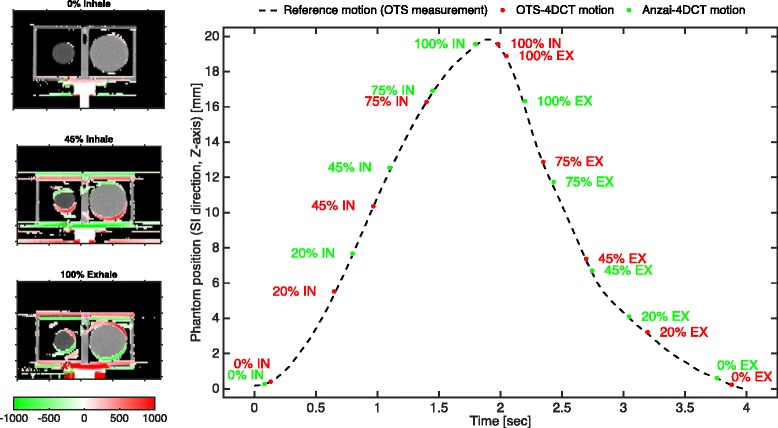
reconstructed phantom motion from 4DCT images sorted by using amplitude-based binning criteria with optical (OTS-4DCT) and Anzai (Anzai-4DCT) motion data. Coronal image cuts are shown in the left panel for the two worst cases (45% Inhale – 100% Exhale) using the red-to-green color map to show the difference of pixel intensities [Hounsfield Units - HU] in OTS-4DCT with respect to the Anzai-4DCT. The best case “0% inhale” is shown for comparison. In the right panel the motion trajectories derived from the two 4DCT dataset are compared with the nominal phantom position in the entire breathing cycle