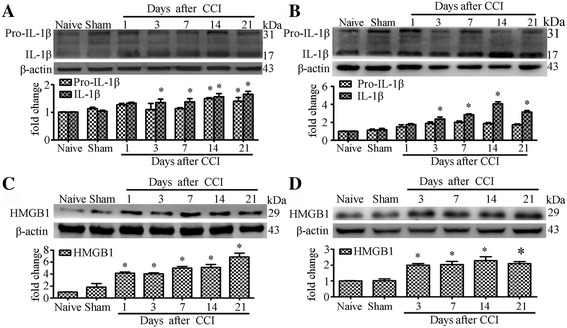
Fig. 2.

CCI increase expression IL-1β and HMGB1 in rat DRG and SDH. a and b Western blot analyses the time course for Pro-IL-1β and IL-1β expression in DRG (A) and SDH (B). c-d Western blot analyses the time course for HMGB1 expression in DRG (C) and SDH (D). Western blot analysis is shown on the top; quantification of protein levels (relative to naive group) is shown on the bottom. N = 4 in each group, One-way ANOVA, *P < 0.05 vs. naive or sham
