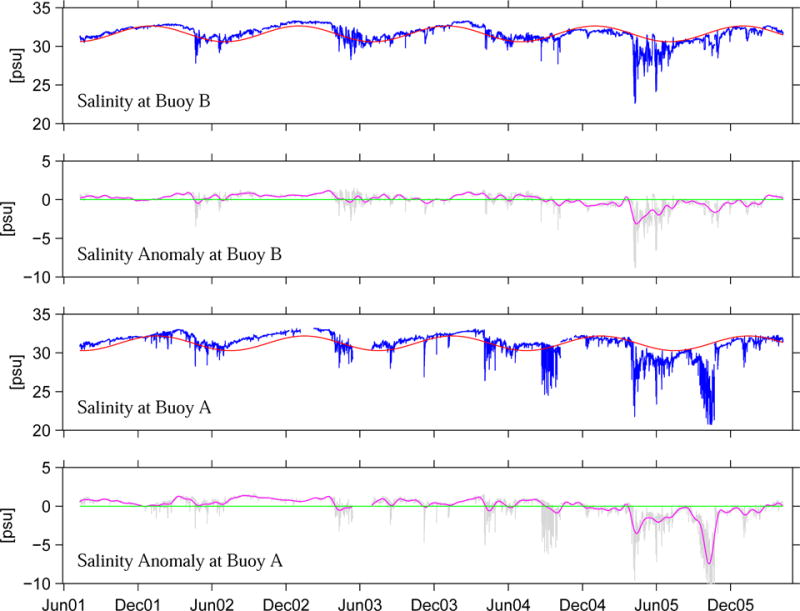
Figure 9.

Time series of surface salinity measured by GoMOOS moorings for the period from June 2001 to June 2005. For each time series, a seasonal cycle Sseasonal is fitted and superposed with raw hourly data in panels 1 and 3. The salinity residual (Sraw-Sseasonal) and its 30-day low-passed filtered rendition are shown in panel 2 and 4, respectively for moorings B, and A.
