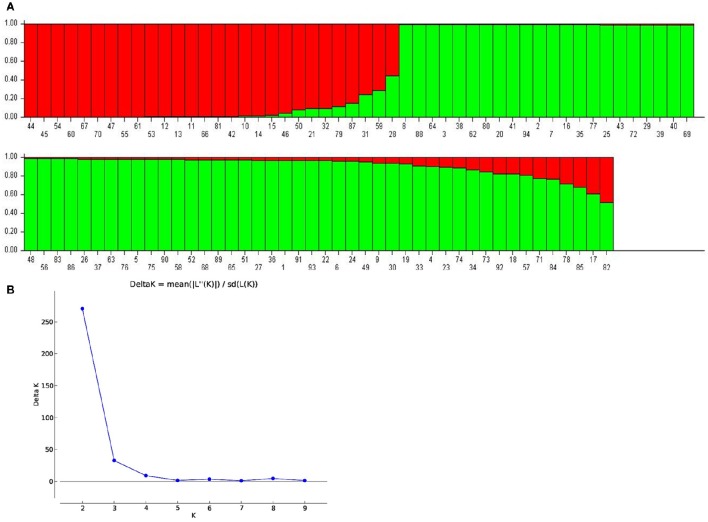
Figure 2.
(A) Population structure inferred from 60 SSR markers. Each genotype is represented by a vertical bar carrying K colored segments which indicates the estimated membership proportion to the K cluster (K = 2). Serial numbers are assigned according to Supplementary Table 1. (B) The true value of K was obtained following the delta K method of Evanno et al. (2005).

