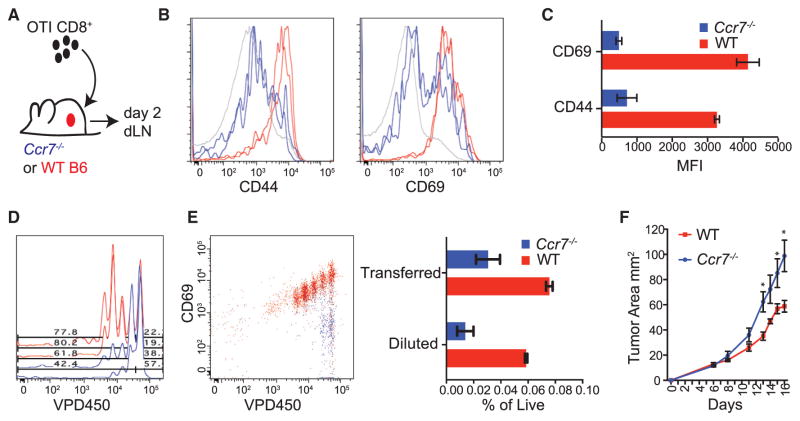
Figure 4. CCR7-Dependent Trafficking of Tumor Antigen to the Tumor dLN Is Required for Anti-Tumor T Cell Priming In Vivo.
(A) Schematic of adoptive transfers of labeled T cells into tumor-bearing WT or Ccr7−/− mice for dLN analysis.
(B) Representative flow cytometric histogram of CD44 and CD69 expression on transferred T cells in the tumor dLN after 48 hr from either WT (red) or Ccr7−/− (blue) mice, with endogenous T cells in gray. Duplicate histogram overlays represent individual mice. Data are representative of two independent experiments.
(C) Quantified geometric mean fluorescent intensity of CD69 and CD44 expression of transferred OTI T cells in the tumor dLN of WT or Ccr7−/− mice at 48 hr. Data are presented as mean ± SEM (n = 3) and are representative of two independent experiments.
(D) Representative flow cytometric plots of proliferation measured by dye dilution of adoptively transferred OTI T cells in the dLN of tumor-bearing WT (red) or Ccr7−/− (blue) mice 2 days following transfer.
(E) Representative flow cytometric plots of dye dilutions of adoptively transferred OTI T cells in the dLN of tumor-bearing WT (red) or Ccr7−/− (blue) mice following transfer and plotted against CD69 expression. Quantified frequencies, as a percentage of total live LN cells, are plotted for the proportion of recovered transferred T cells (Transferred) as well as the proportion of those transferred T cells that divided (Diluted). Data were pooled from dual-flank-bearing tumor animals, and plotted as mean ± SEM (n = 3). Data are representative of two independent experiments.
(F) Tumor growth curves for ectopic B78ChOVA tumors in Ccr7−/− or aged-matched WT C57BL/6 mice over 16 days (without adoptively transferred T cells). Data are presented as tumor area and plotted as mean ± SEM (n = 5). *p < 0.05.

