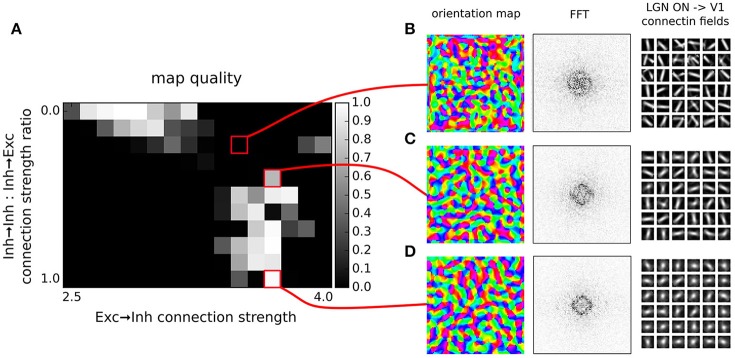
Figure 5.
Orientation map development with short range inhibition, a fast excitatory-to-inhibitory-to-excitatory loop and inhibitory to inhibitory connections. (A) Map quality (see Section 2) at a range of inhibitory to inhibitory vs. inhibitory to excitatory projection strength ratios and excitatory to inhibitory connection strengths. (B–D) Functional organization in 3 example parameter configurations indicated by the red marks. From left to right, the orientation map, the lateral interaction kernel (LIK; this is calculated based on Equation 14), fast-Fourier transform of the orientation map and afferent connection fields from the ON LGN model sheet for 25 example model V1 neurons.

