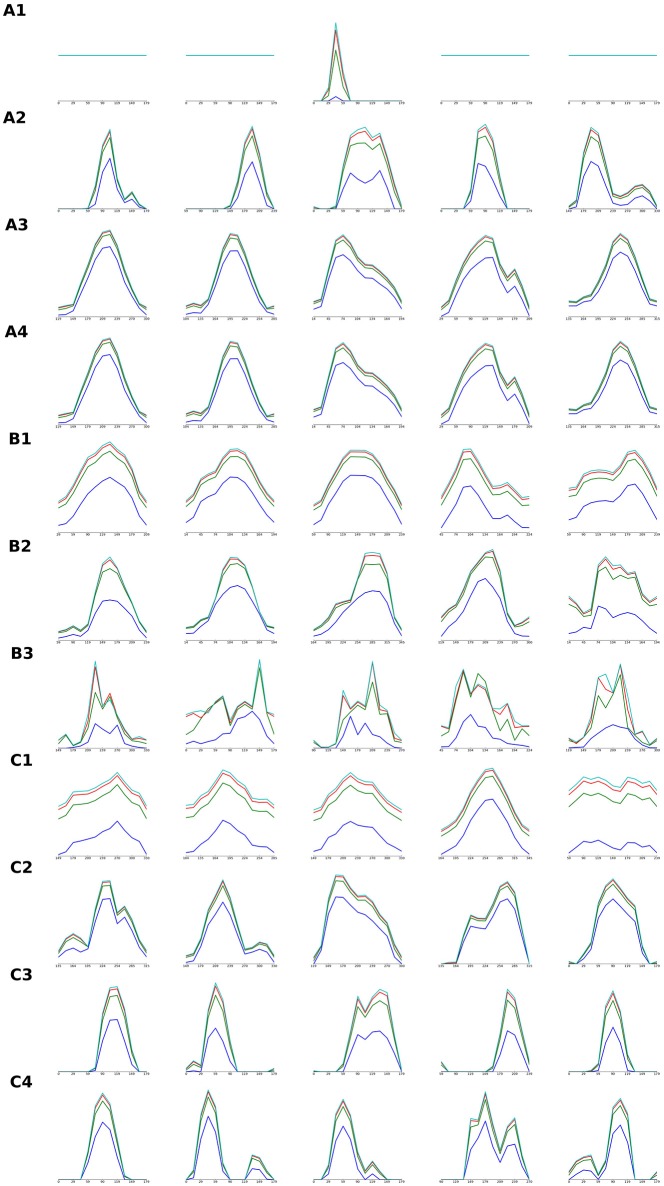
Figure 8.
Orientation tuning curves of individual V1 model units in models detailed in Figures 4–6. Each row of the figure shows orientation tuning curves measured at 4 different contrasts of 5 model units, one in the center of the modeled cortical area and 4 positioned in the middle between the center and one of the 4 corners of the modeled cortical area. Each row corresponds to one of the model parameterizations that were detailed (i.e., their orientation map etc. was shown) in Figures 3–5: tuning curves marked with (A) correspond to models from Figure 4, (B) from Figure 5, and (C) from Figure 6. The order of the rows corresponding to a given Figures 4–6 (i.e., marked with A,B,C) is the same as the order in which the model parametrization in the given figure were presented (i.e., orientation tuning curves measured in the model parametrization presented in the 2nd row of Figure 5 will be displayed in the row marked as (B2) in this figure).

