Figure 2.
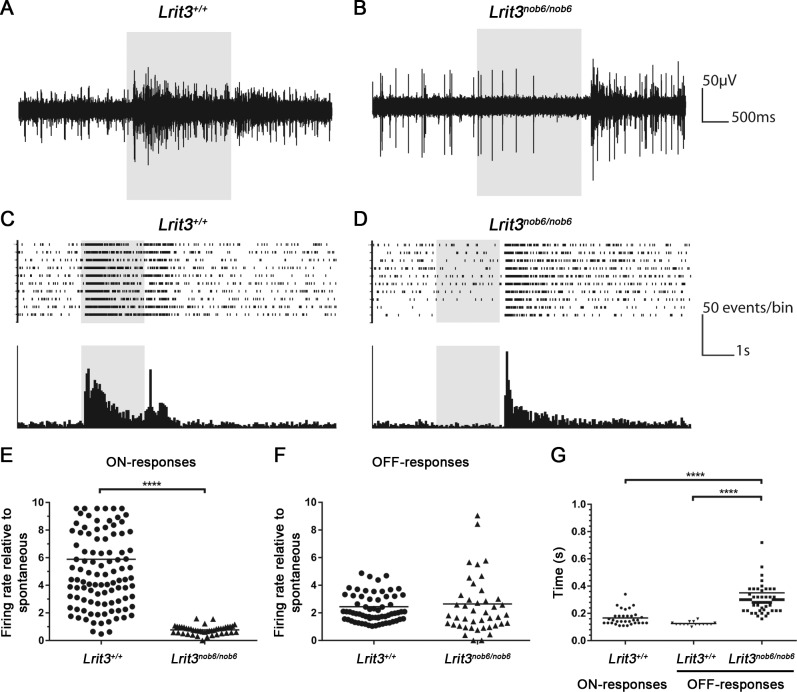
ON- and OFF-responses of RGCs in Lrit3nob6/nob6 retinas. Representative RGC activity recording from an Lrit3+/+ retina (A) and an Lrit3nob6/nob6 retina (B). The gray box corresponds to the light stimulus. Horizontal scale bar: 500 ms; vertical scale bar: 50 μV. Representative raster plot (up) and peristimulus time histogram (bottom) from an Lrit3+/+ retina (C) and an Lrit3nob6/nob6 retina (D). The gray box corresponds to the light stimulus. Horizontal scale bar: 1 second; vertical scale bar: 50 events/bin. Maximum firing rate of ON- (E) and OFF-responses (F) in Lrit3nob6/nob6 retinas compared to Lrit3+/+ retinas relative to the spontaneous activity. Bars represent median values. Asterisks represent results that are significantly different (P < 0.05). (G) Time for which the maximum firing rate is reached after the light stimulus onset for ON-responses in Lrit3+/+ retinas and the light stimulus offset for OFF-responses in Lrit3nob6/nob6 retinas compared to Lrit3+/+ retinas. Bars represent median values. Asterisks represent results that are significantly different (P < 0.05).

