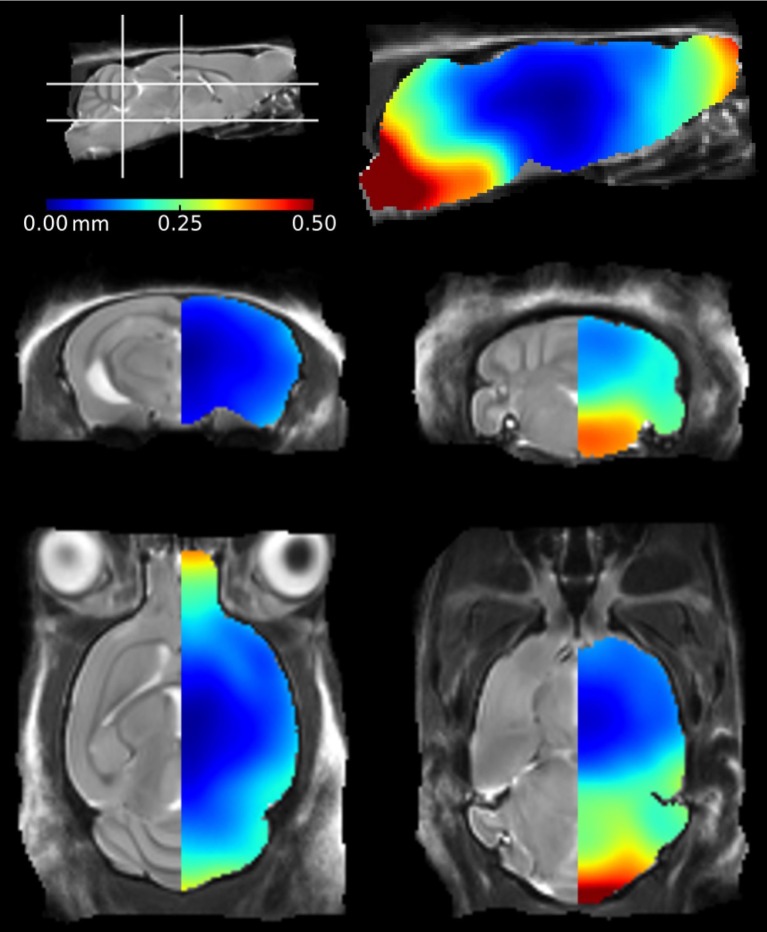
Figure 2.
Mean positional distance maps showing local distortions of the ex vivo mouse brains in comparison to their in vivo mouse brain template. Deformations were calculated at a voxel-wise level. The color bar illustrates the mean distance traveled by a voxel during registration of the ex vivo mouse brains to the in vivo atlas.

