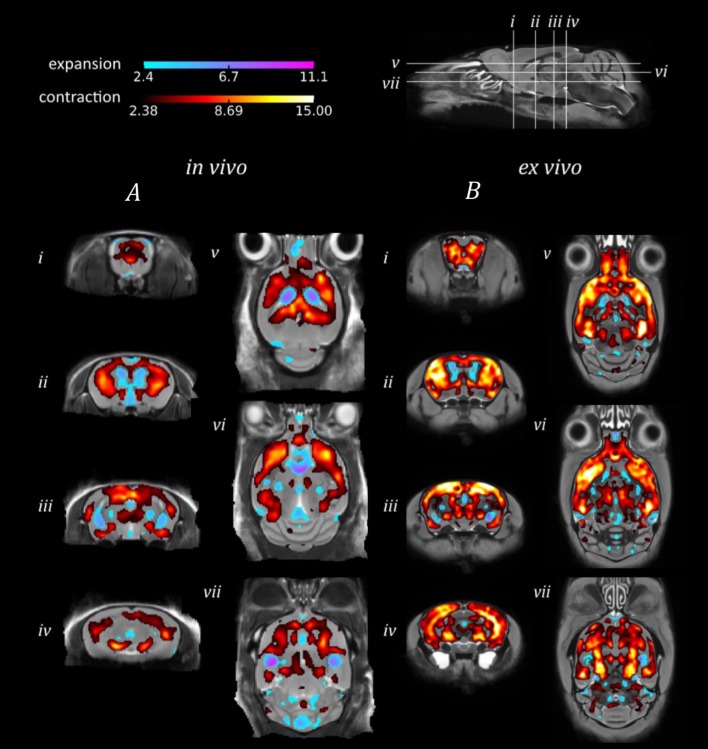
Figure 3.
TBM results for the morphological comparison between rTg4510 mice and wild-type controls. Results from (A) in vivo and (B) ex vivo structural analysis, showing TBM statistical results overlaid on representative axial and coronal slices of the final group average image after 20 iterations of NRR. Red: regions where the rTg4510 brains are relatively locally smaller than the wild-type controls; blue: rTg4510 brains are locally larger. Based upon FDR-corrected t-statistics (q = 0.05).

