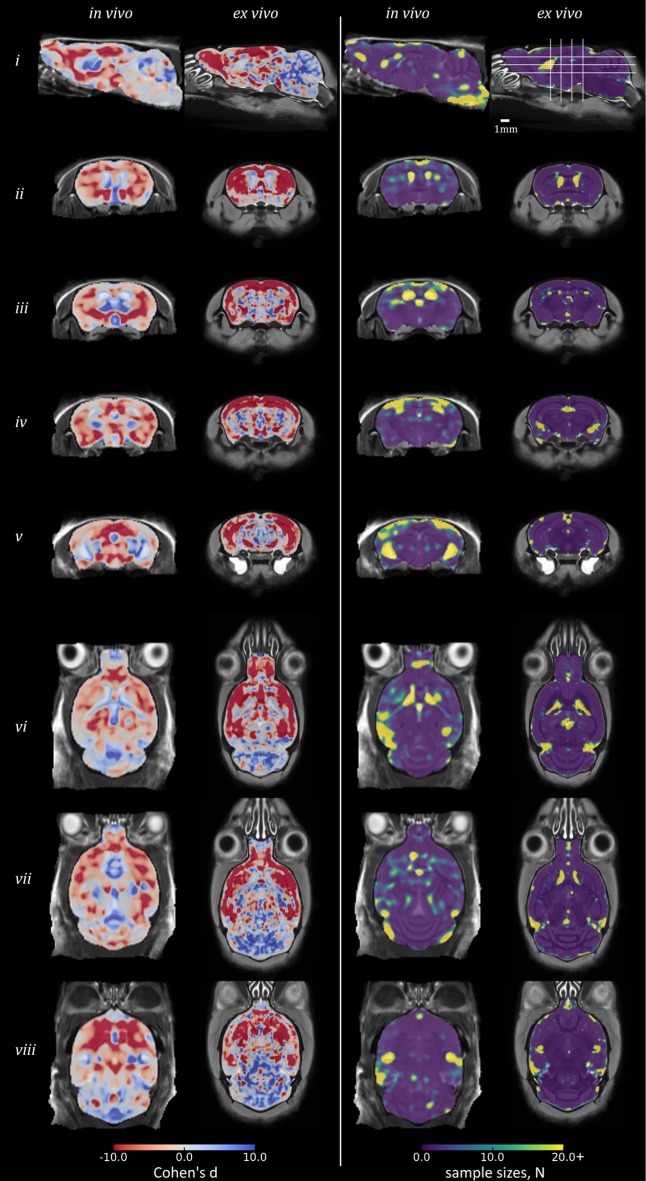
Figure 5.
Power analysis results in rTg4510 data compared with wild-type: Cohen's d and sample sizes. Equivalent sagittal, coronal and transverse slices on in vivo and ex vivo GWR average images, overlaid with the Cohen's d (left) and sample sizes N (right) required to show a significant effect, with α = 0.05, β = 0.2, and an effect size 25% of the local wild-type mean volume. For Cohen's d: red, rTg4510 group locally smaller than wild-type; blue: larger.

