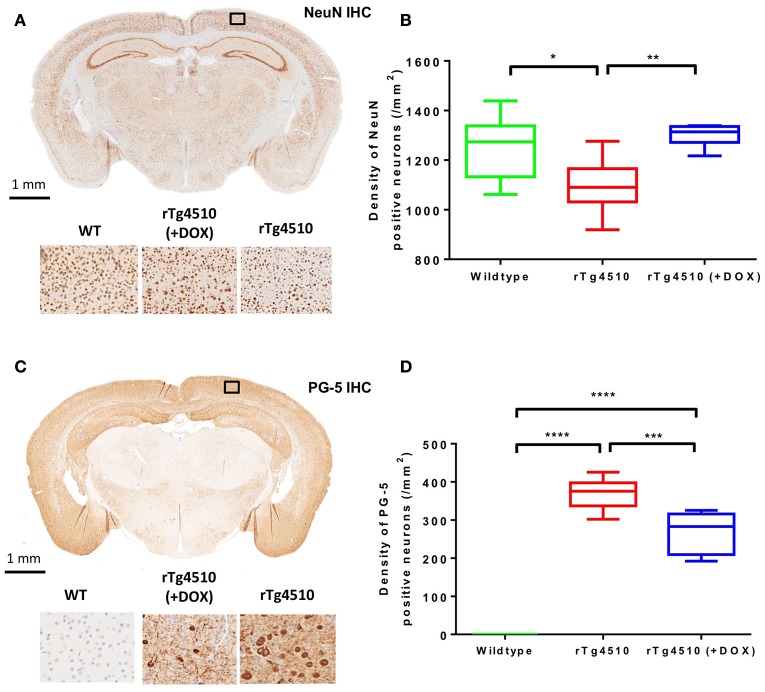
Figure 6.
Immunohistochemistry to estimate cortical NeuN and PG-5 positive cell density. Representative coronal slice illustrating the distribution of (A) NeuN and (C) PG-5 positive neurons in the cortex of an untreated rTg4510 mouse. Quantitative estimates of (B) NeuN and (D) PG-5 positive cell density in the cortex for each of the 7 wild-type, 10 untreated rTg4510 and 6 treated rTg4510 mice at 7.5 months of age. Whiskers represent the maximum and minimum values. *p ≤ 0.05; **p ≤ 0.01; ***p ≤ 0.001; ****p ≤ 0.0001.

