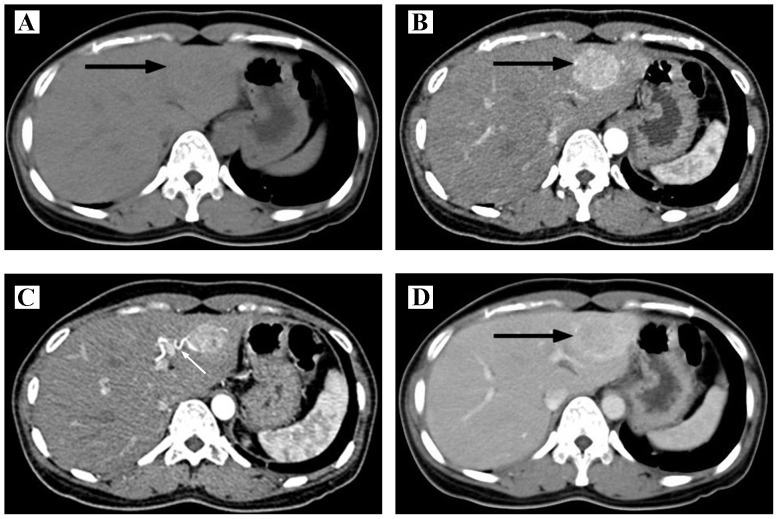
Figure 1.
Imaging characteristics of hepatic PEComa. (A) Computed tomography scan, revealing that the lesion is a low-density mass (denoted by the black arrow). (B) Contrast-enhanced CT, revealing a non-homogeneously enhanced lesion during the arterial phase (black arrow). (C) Contrast-enhanced CT shows the curve feeding artery of the lesion during the arterial phase (white arrow). (D) Contrast-enhanced CT shows the lesion enhanced slightly lower than liver parenchyma during portal phase. CT, computed tomography; PEComa, perivascular epithelioid cell neoplasm.

