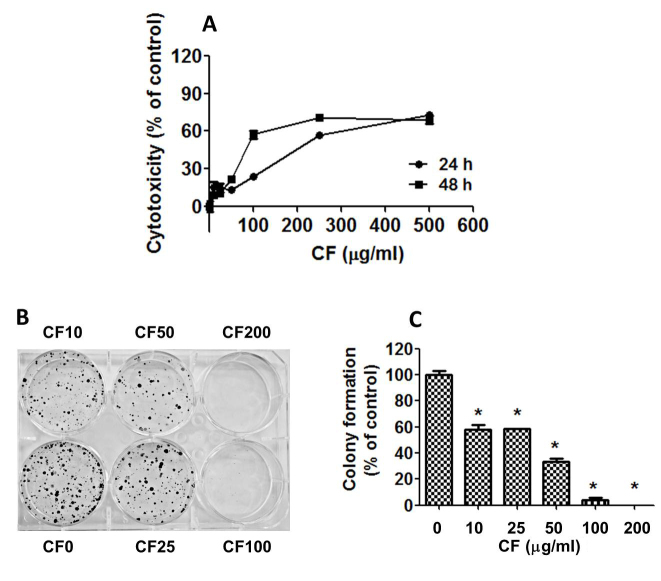
Figure 1.
Effect of CF on HepG2 cell death and cell regrowth. (A) HepG2 cancer cells were treated with various concentrations of CF (0–500 µg/ml) for 24 and 48 h. Cell death was determined using an SRB assay. (B and C) Cells were treated with various concentrations of CF (0–200 µg/ml) for 24 h. Subsequently, the cells were cultured for 24 days and examined via clonogenic assay. The results are presented as the percentage of the untreated control groups (0 µg/ml), and represent means ± standard error of the mean from three independent experiments. *P<0.05 vs. untreated control groups (0 µg/ml). CF, Cratoxy formosum.

