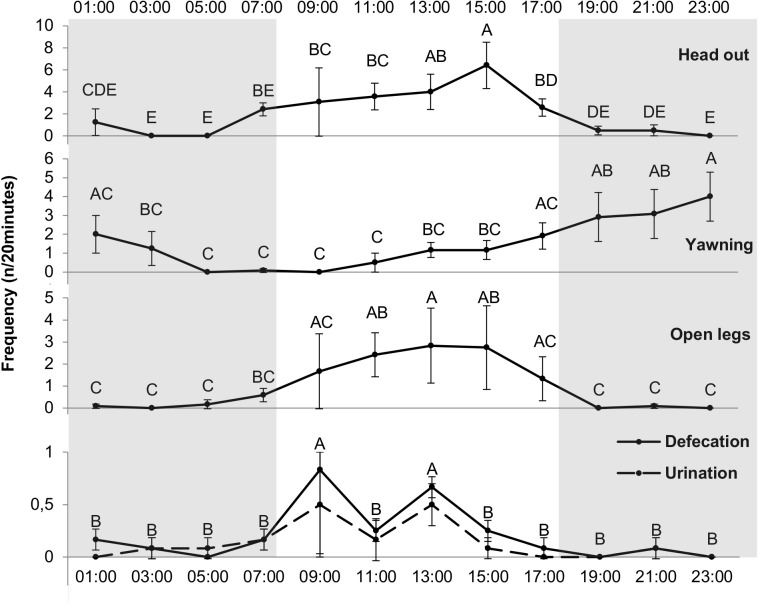
Figure 5. Frequency of different behavioral events (n∕20 min) for each hour.
Grey and white backgrounds represent the dark and the light period of the day, respectively. Arrows represent food distribution times (grey for hay and black for concentrate). Values within the same graph with the same superscript letter are not significantly different from one another (p > 0.05).

