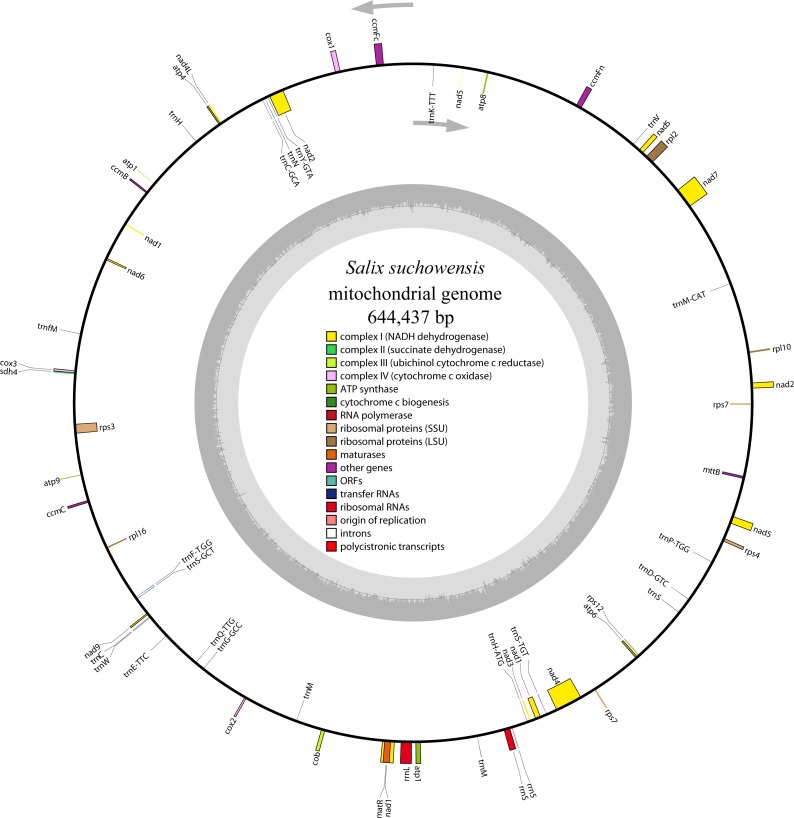
Figure 1. The circular mitochondrial genome of S. suchowensis.
Genomic features on transcriptionally clockwise and counter-clockwise strands are drawn on the inside and outside of the circle, respectively. Genes belonging to different functional groups are color-coded. GC content is represented on the inner circle by the dark gray plot.

