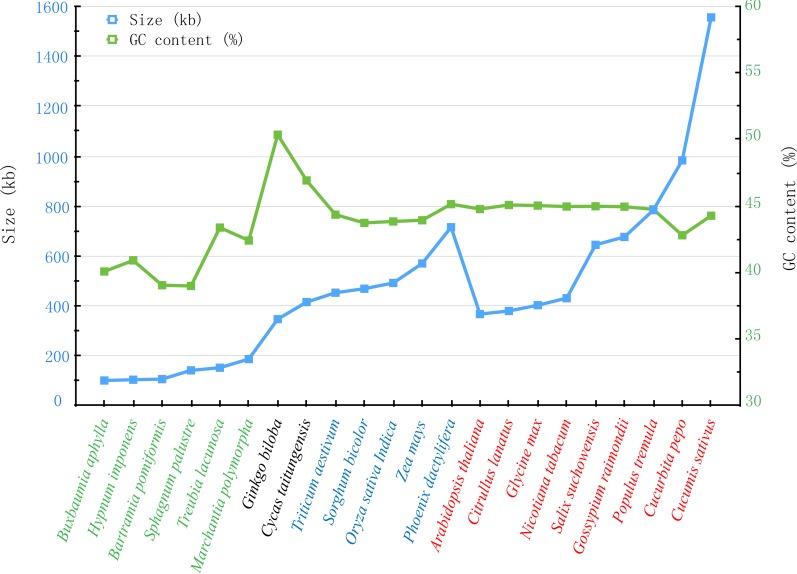
Figure 7. Comparison of sizes and GC contents within 22 land plant mt genomes.
The blue and green broken lines represent the sizes and GC contents, respectively. The colors of green, black, blue and red indicate different species in Bryophyte, Gymnospermae, Monocotyledoneae and Dicotledonae, respectively.

