
Figure 2.
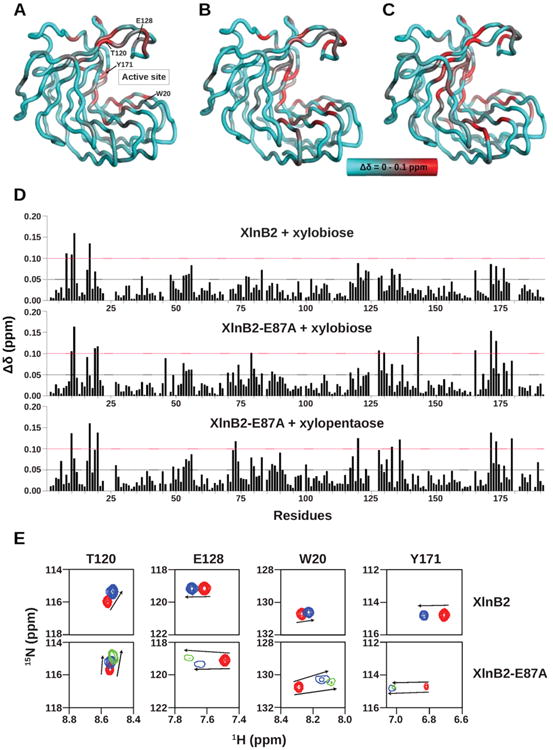
1H–15N composite chemical shift variations experienced by XlnB2 and XlnB2-E87A upon oligoxyloside binding. Structural mapping of chemical shift variations (Δδ) observed for (A) XlnB2 induced upon xylobiose (X2) binding, (B) XlnB2-E87A induced upon xylobiose binding, and (C) XlnB2-E87A induced upon xylopentaose (X5) binding. The Δδ was calculated between free and ligand-saturated enzymes as described by the equation Δδ (ppm) = [;(ΔδHN2 + ΔδN2/25)/2]1/2 and reported on the three-dimensional structure of XlnB2 using a cyan-to-red color scale with a 0.0–0.1 ppm range.35 The locations of the active site and key residues are reported on the 3D structure in panel A. (D) Bar graph representation of the chemical shift variations observed for XlnB2 and XlnB2-E87A upon binding to xylobiose (X2) and xylopentaose (X5). Δδ > 0.05 ppm and Δδ > 0.1 ppm chemical shift changes are represented by black and red dotted lines, respectively. (E) 1H–15N chemical shift direction and magnitude for residues Trp20, Thr120, Glu128, and Tyr171 in XlnB2 and XlnB2-E87A observed upon ligand binding (see the text for details). The 1H–15N peak position of the free enzyme and that upon saturation with X2 (X5) is shown in red and blue (green), respectively. All images were prepared with PyMOL, and graphs were produced with GraphPad Prism.