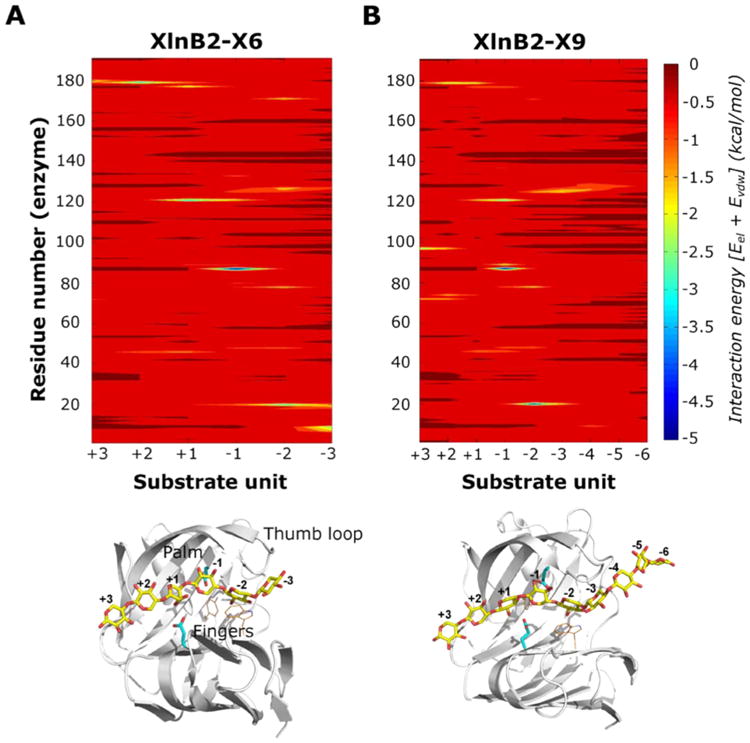
Figure 4.

Protein–ligand interactions of the XlnB2–substrate binary complexes. Protein–substrate interaction energy maps for (A) XlnB2-X6 and (B) XlnB2-X9 binary complexes displaying the average interaction energies between XlnB2 and the substrate. Interaction energies were calculated as the sum of van der Waals and electrostatic energies averaged over all simulation snapshots (see Experimental Procedures). Favorable interactions correspond to the blue end of the spectrum, while unfavorable interaction energies correspond to the red end of the spectrum. The bottom panel shows the structure of the binary complex between XlnB2 and X6/X9 substrate (yellow sticks) used for the MD simulations. Residues within 4 Å of the ligand that display millisecond conformational exchange in the apo and ligand-bound states, determined from NMR relaxation dispersion experiments, are displayed as orange lines. Catalytic residues are shown as cyan sticks. The individual sugar units of the substrate are numbered according to the standard nomenclature for the reducing and nonreducing units.
