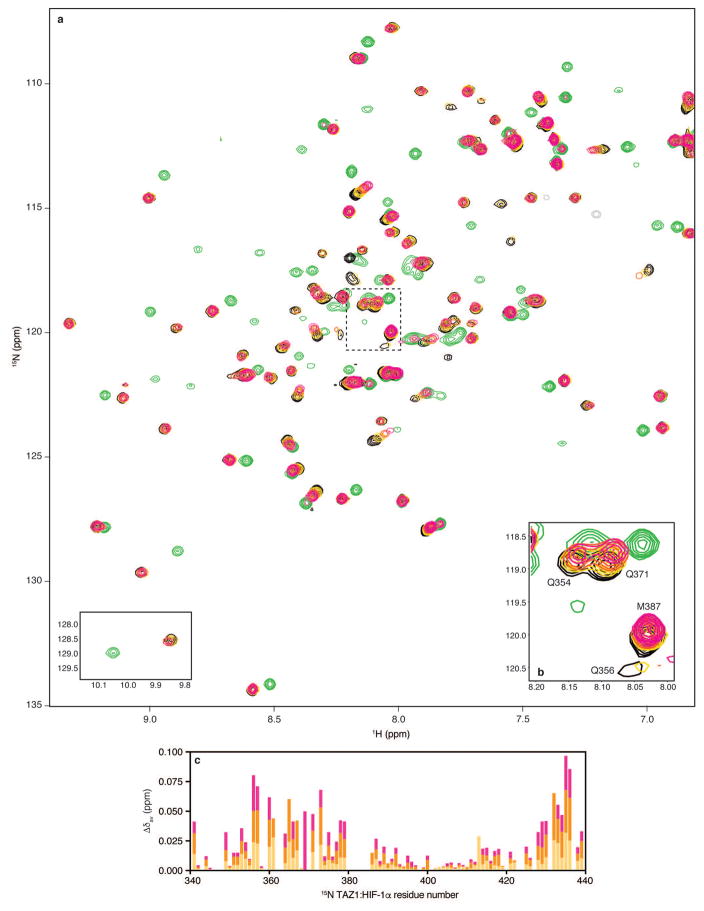
Extended Data Figure 7. Monitoring HIF-1α and CITED2 216-242 competition for 15N-TAZ1 binding by NMR spectroscopy.
a, Full 1H-15N HSQC spectra from NMR competition experiments with HIF-1α peptide and CITED2 216-242. Superimposed spectra are shown for 15N-TAZ1 in the presence of one molar equivalent of HIF-1α peptide (black), five molar equivalents of CITED2 216-242 (green), and one molar equivalent of HIF-1α peptide plus one (gold), three (orange), and five (magenta) molar equivalents of CITED2 216-242. The tryptophan indole amide resonances are shown as an inset in the lower left corner. b, Detailed view of selected 15N-TAZ1 resonances. The spectral region highlighted in panel b is marked by the dotted lines on the full spectra in a. The spectra are displayed as described for a. c, Weighted average 1H-15N chemical shift changes (Δδav) for each 15N-TAZ1:HIF-1α residue upon addition of one (gold), three (orange), or five (magenta) molar equivalents of CITED2 216-242. Weighted average 1H-15N chemical shift changes were calculated as Δδav = [(δH)2 + (δN/5)2]1/2.

