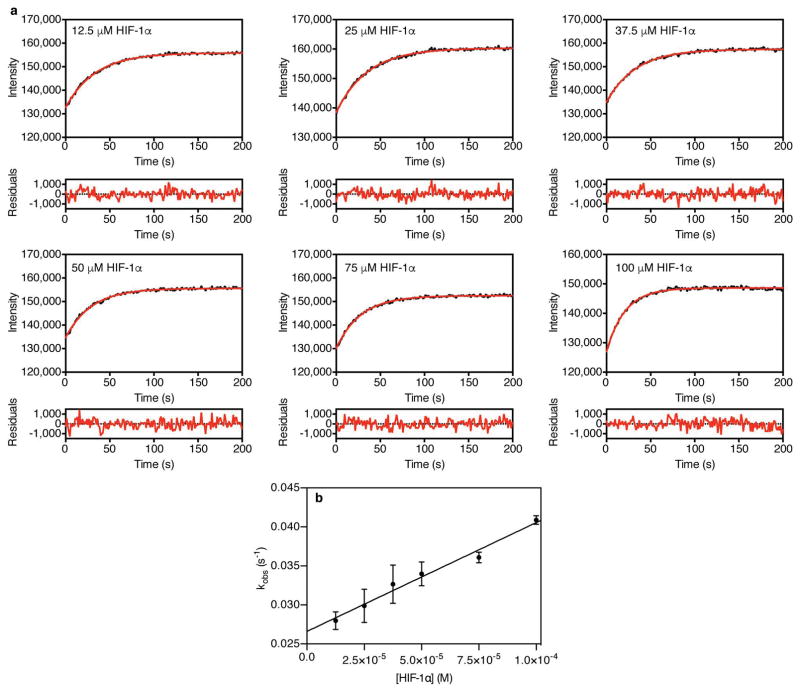
Extended Data Figure 5. Monitoring HIF-1α competition for TAZ1 binding by fluorescence.
Representative time-resolved fluorescence data for mixing of unlabeled HIF-1α peptide with Alexa Fluor 488-labeled HIF-1α peptide in a pre-formed complex with unlabeled TAZ1 (complex concentration = 0.25 μM). The data shown are the average of 3 independent measurements. The concentrations of HIF-1α peptide used in each experiment are indicated in the upper left corner of each graph. The red lines are fits to a single exponential function, and the residuals from fitting are shown below the graph of the data obtained at each concentration of HIF-1α. b. Concentration dependence of observed rates (kobs) from time-resolved fluorescence experiments monitoring HIF-1α competition for TAZ1 binding, determined by standard fluorescence intensity measurements. The data shown represent the average (circles) and standard deviation (error bars) of three independent measurements. The solid black line is the result of fitting to a linear function.

