
Figure 3.
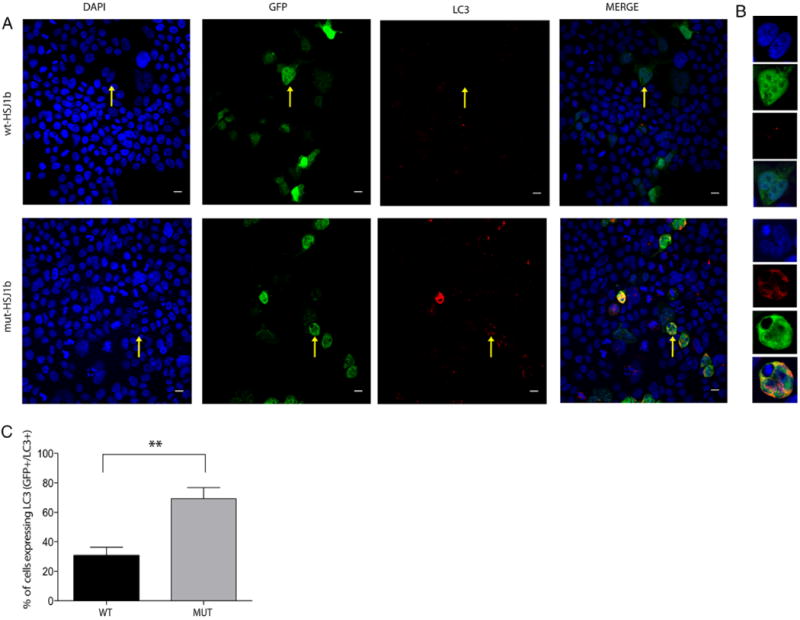
Increased co-localization of LC3 in mutant HSJ1b transfected cells versus wild type. A: LC3 localizes in both transfected (GFP+ cells) and non-transfected cells (GFP− cells), being highly localized in cells presenting aberrant nuclei and big aggregates (yellow arrow, lower panel, mut-HSJ1b). However, transfected HEK293 cells with wild type HSJ1b have small aggregates and low levels of LC3 (yellow arrow, upper panel, wt-HSJ1b). B: Zoomed images of a sample cell with low levels of LC3 (upper panel, wt-HSJ1b) and a sample cell with high levels of LC3 (lower panel, mut-HSJ1b). C: Quantification of HEK293 transfected cells expressing LC3 (GFP+/LC3+) in wild type (solid black column) and mutant (solid gray column) HSJ1b (percentage of GFP+/LC3+ cells, wt-HSJ1b = 34.5% and mut-HSJ1b-Mut = 64.6%, P = 0.002, Mann–Whitney non-parametric test. Values represent the mean SEM. **P < 0.01. Scale bar = 50 μm.