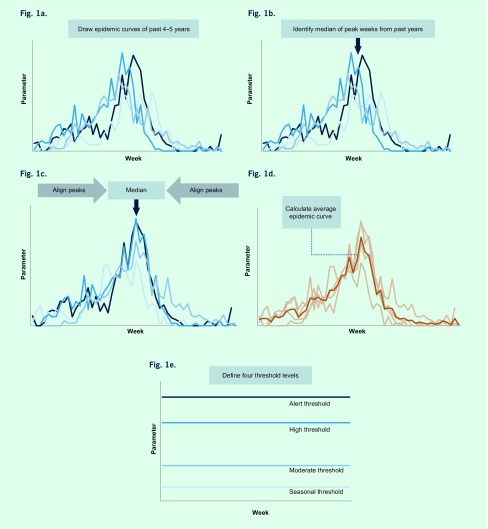
Fig. 1.
Illustration of the WHO method to establish four levels of thresholds (adapted from WHO Global Epidemiological Surveillance Standards for Influenza) based on proportion of laboratory specimens from ILI patients positive for influenza (proportion positive) data from Cambodia, 2009 to 2015)
A. Draw epidemic curves for previous 4 or 5 years with calendar week on x-axis and parameter on y-axis.
B. Identify median of peak weeks from past years.
C. Shift the data from previous years to the point where their respective peaks align on median of peak weeks identified in B.
D. Calculate an average over the years for each week to create the average epidemic curve.
E. Define thresholds levels.

