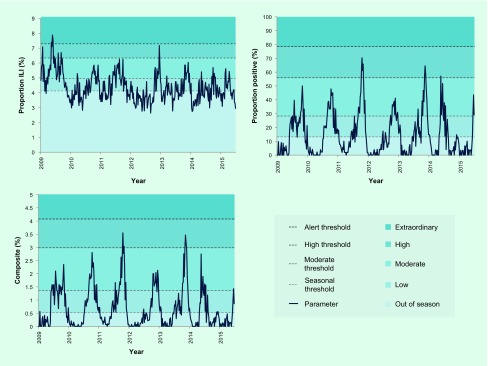
Fig. 2.
Surveillance data from 2009 to 2015 plotted against established thresholds and intensity categorization for three parameters: (1) proportion of ILI patients among all outpatients (proportion ILI), (2) proportion of laboratory specimens from ILI patients positive for influenza (proportion positive), and (3) the product of proportion ILI and proportion positive (composite)

