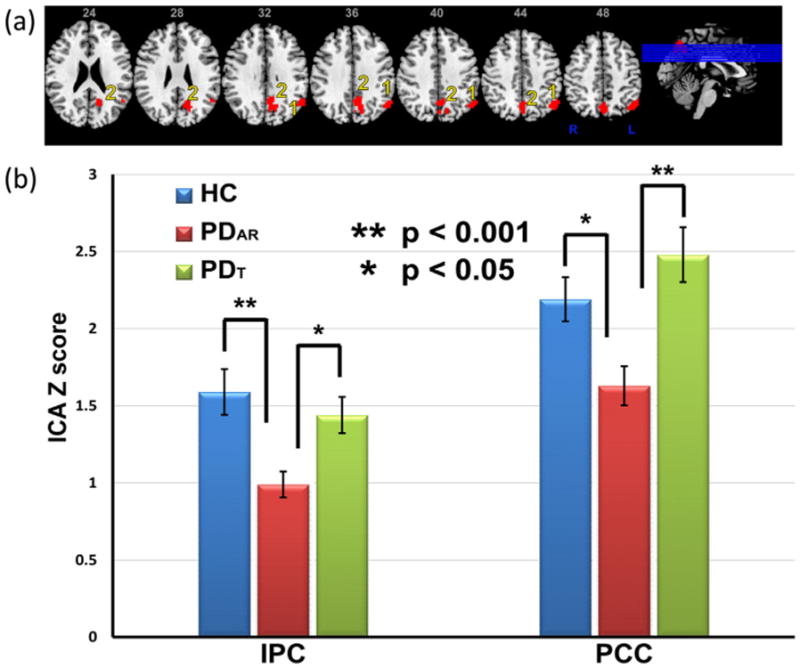
Fig. 2.

(a). Areas showing differences in activity in PD patients and healthy controls (HCs). Images are in radiological orientation. 1) left inferior parietal cortex (IPC) and 2) left posterior cingulate cortex (PCC). (b) Bar graph showing differences in ICA z-scores between HC, PDAR and PDT subjects. Data represent the mean ± SEM.
