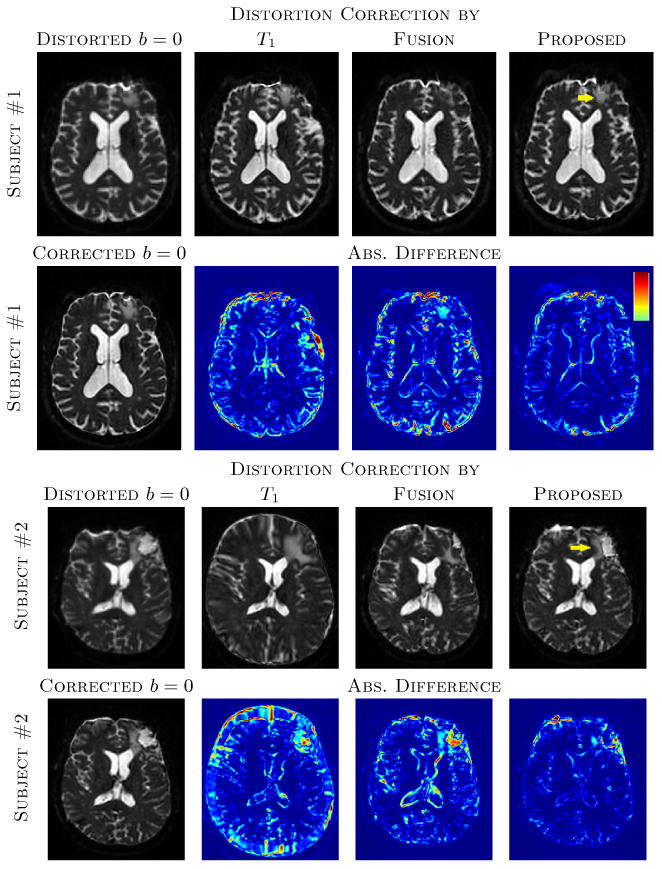
Fig. 2.

The top two rows show distorted b = 0 and corrected b = 0 images via T1, original T2, synthetic T2s from Fusion [14] and the proposed method, along with absolute difference images from the original T2 corrected b = 0. The “Corrected b = 0” indicates b = 0 image corrected by original high resolution T2. The same image slices of subject #1 of Fig. 1 are shown. Bottom two rows shows similar slices for the subject #2 from Fig. 1. Yellow arrows indicate the lesions that are better reconstructed with the proposed synthesis. The colormap of the absolute difference images indicate 0 to 30% of the maximum intensity of the b = 0 images. Note that the distortion correction for subject #2 using the T1-w image yielded gross scaling errors.
