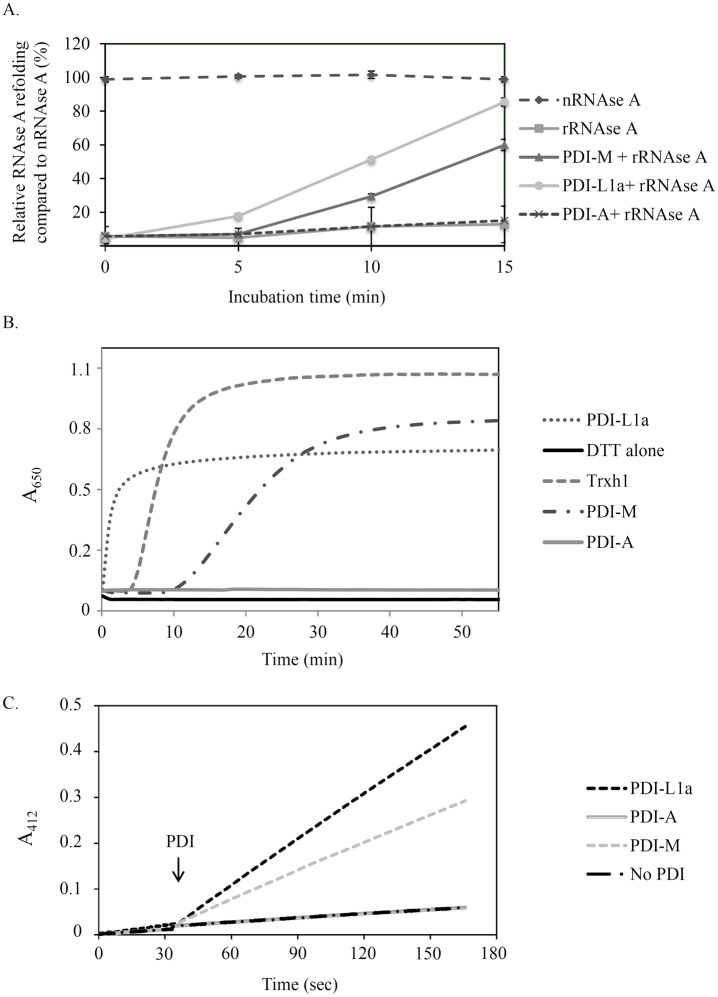
Fig 2. Comparative analysis of the oxidoreductase activities of poplar PDI isoforms.
A. Oxidative refolding of RNase A. Results are represented as percentages of activity relative to the activity of native RNase A (nRNase A). The reduced RNase A (rRNase A) was tested alone or upon incubation with PDI-L1a, PDI-M or PDI-A for the indicated times. Measurements were made in triplicate and error bars indicate standard deviation. B. Insulin reduction. It was assessed by measuring the turbidity at 650 nm caused by the precipitation of insulin upon reduction with DTT alone or supplemented with 5 μM PDI-L1a, PDI-M, PDI-A or Trx h1. The reaction curve shown is representative of at least three independent repetitions. C. PDI reduction by AtNTRB. DTNB reduction was followed at 412 nm in the presence of NADPH, AtNTRB alone or with PDI-L1a, PDI-M or PDI-A. The PDI have been added after 30 seconds. The reaction curve shown is representative of at least three independent repetitions.

