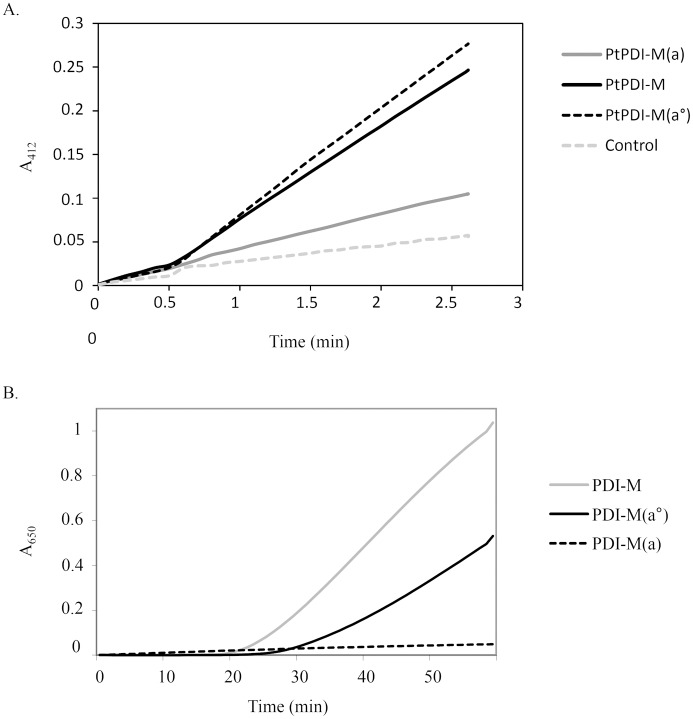
Fig 7. Reduction of the PDI-M catalytic domains by AtNTRB as assayed using DTNB and insulin.
A. DTNB reduction assay. Representative kinetic curves obtained in the presence of NADPH and AtNTRB alone or with 0.2 μM PDI-M, PDI-M(a°) or PDI-M(a). B. Insulin reduction assessed using NADPH/AtNTRB as an electron donor system and 5 μM of PDI-M, PDI-M(a°) or PDI-M(a).

