
Figure 2e:
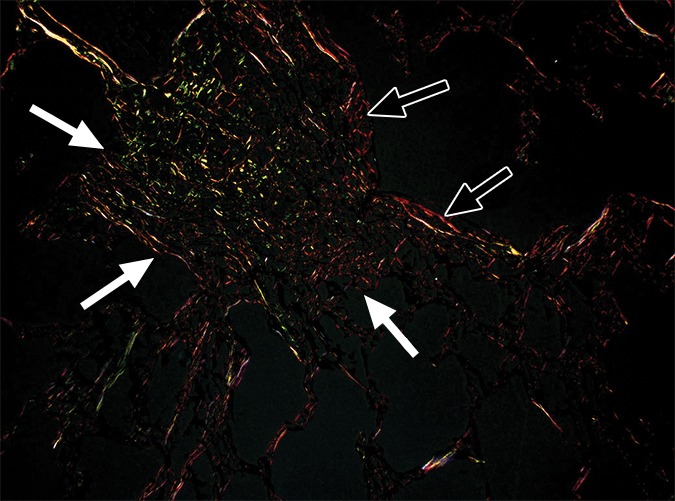
Images show areas of ground-glass opacity. (a) CT image of lung 3 shows ground-glass opacities in the dependent area in the right upper lobe. Scale bar = 1 cm. (b) Micro-CT image at the same level as a shows some small areas of increased attenuation (arrows). Scale bar = 1 mm. (c) Photomicrograph corresponds to b. (Hematoxylin-eosin stain; original magnification, ×12.) (d) Photomicrograph corresponds to the indicated region in c. (Picrosirius red stain; original magnification, ×100.) (e) Photomicrograph of the same region as in d obtained with a polarizing filter. The opacities on b correspond to areas of abnormal tissue, with a reticular network of fine green fibers (white arrows) and a few thicker strands of red collagen at the periphery (black arrows).