
Figure 4e:
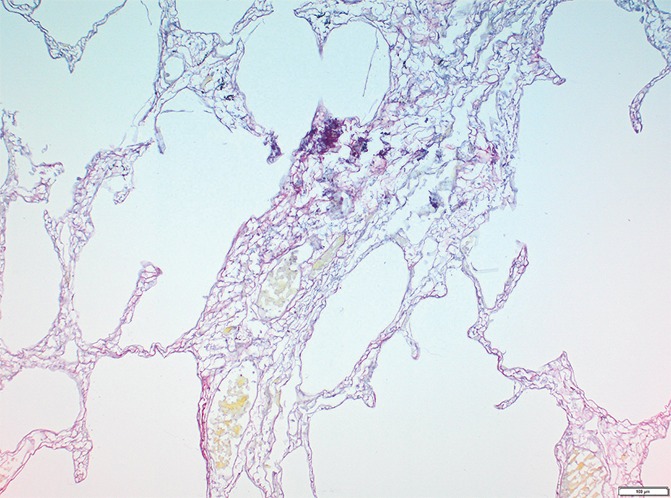
Images show minimal changes. (a) Micro-CT image of a core from lung 1 shows islands of increased tissue attenuation along an interlobular septum. Scale bar = 1 mm. (b) Photomicrograph of the tissue slice corresponding to a. (Hemotoxylin-eosin stain; original magnification, ×12.) (c–f) Photomicrographs obtained without (c, e) and with (d, f) a polarizing filter. (Picrosirius red stain; original magnification, ×100). Native collagen in the alveolar walls shows strong bifrefringence and has a red appearance (white arrows). One part of the linear increased attenuation in sample A (c, d) corresponds with thick bundles of the same red to yellow collagen orderly organized in close contact with each other (black arrows). In sample B (e, f), which was obtained in a more irregular part of the linear opacity, there is an added irregular reticular network of fine green fibers (arrows).