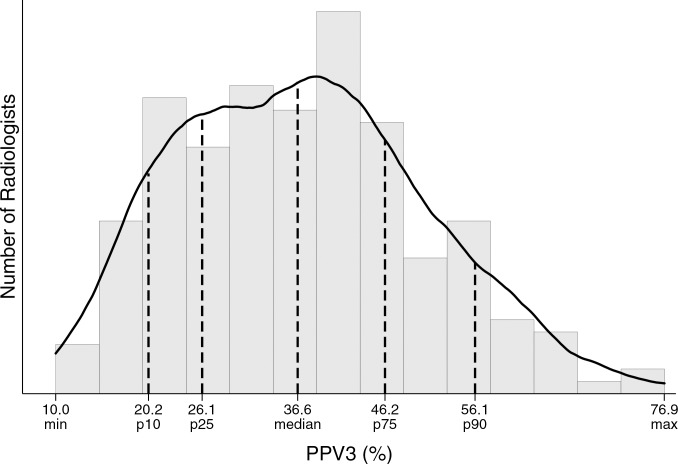
Figure d:
Distribution of diagnostic mammography imaging performance metrics by radiologist (a) cancer detection rate, (b) abnormal interpretation rate, (c) PPV2, (d) PPV3, (e) sensitivity, and (f) specificity. Dashed lines indicate location of 10th, 25th, 50th, 75th, and 90th percentiles. Solid line represents smoothed curve fit to each histogram with kernel density estimation.

