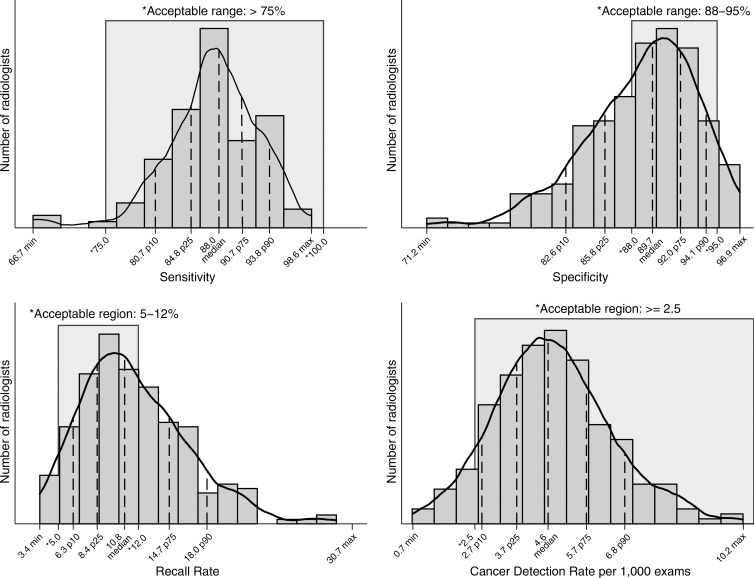
Figure 1:
Graphs show common performance measures. Sensitivity was restricted to final readers with 30 or more cancers (n = 104). Specificity was restricted to final readers with 1000 or more noncancers (n = 249). CDR was restricted to final readers with 1000 or more examinations (n = 242). Recall rate was restricted to final readers with 1000 or more examinations (n = 242). Max = maximum, min = minimum, p10 = 10th percentile, p25 = 25th percentile, p75 = 75th percentile, p90 = 90th percentile.

