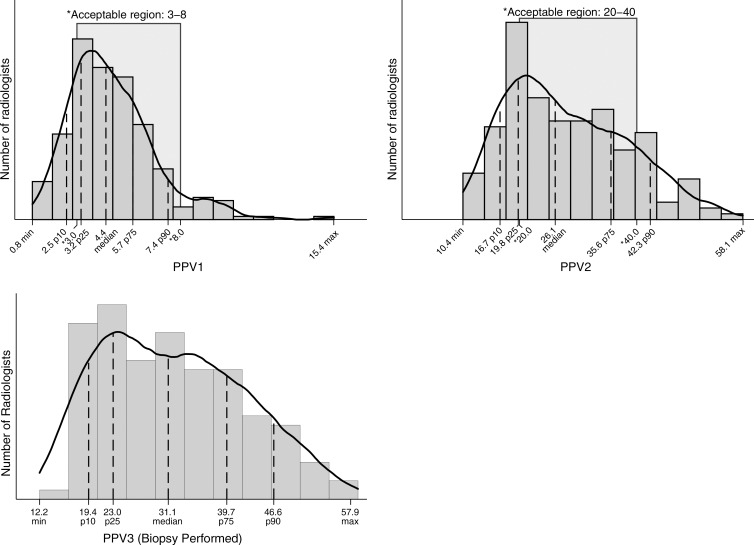
Figure 3:
Graph shows PPVs. PPV1 was restricted to final readers with 100 or more abnormal examinations (n = 255). PPV2 was restricted to final readers with 30 or more recommended biopsies (n = 172). PPV3 was restricted to final readers with 30 or more biopsies performed (n = 125). Max = maximum, min = minimum, p10 = 10th percentile, p25 = 25th percentile, p75 = 75th percentile, p90 = 90th percentile.

