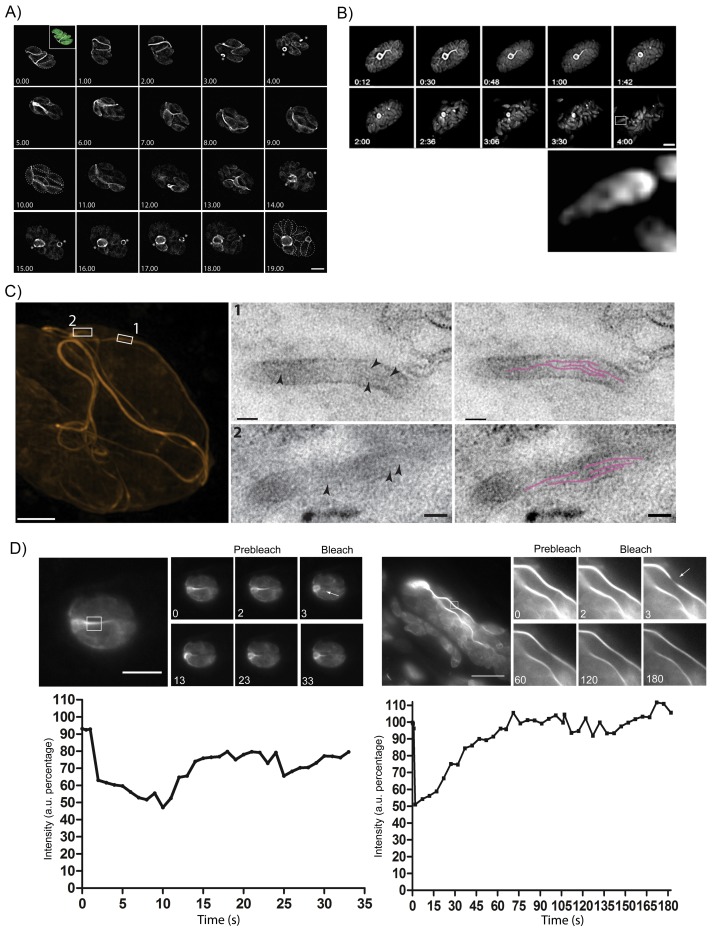
Figure 7. The F-actin network is stable in resting parasites, but highly dynamic during replication and egress.
(A) Analysis of Cb-Halo during two rounds of replication. Images were taken every 30 min for 20 hr (Video 8). The network appears dynamic across the intracellular lifecycle, collapsing into rings during daughter cell emergence (asterisks). Time indicated in hours. Scale bar 5 μm. (B) Collapse of the F-actin network can be triggered by calcium signaling. Parasites were induced for egress with Calcium Ionophore A23187 and imaged at 1 frame per second (Video 9). The network collapses before parasites begin to egress. While filaments quickly collapse, the residual body remains intact during egress and is left behind. Box in lower left image shows freshly egressed parasites (enlarged below), where F-actin appears to accumulate at the posterior pole of the parasite. Time indicated in minutes:seconds. Scale bar, 10 μm. (C) Correlative light electron microscopy (CLEM). A vacuolar network was imaged with 3D-SIM super-resolution microscopy and the same areas were imaged with TEM. Filaments of 5 nm in thickness were present within the network tubules, extending over 100 nm in length. Scale bars: 200 nm (3D-SIM); 50 nm (TEM). (D) FRAP treatment in cells stably expressing Cb-Emerald. The F-actin inside the cells (left panel) and the nanotubular network connecting the parasites (right panel) show different fluorescence recovery times (20 and 60 s respectively), suggesting the presence of different actin dynamics inside the parasite and the filamentous network of the PVs respectively. Intensity in the FRAP area was expressed as intensity percentage of the same unbleached area (filament or nanotubular network). Time is expressed in seconds. Scale bar 5 µm.

