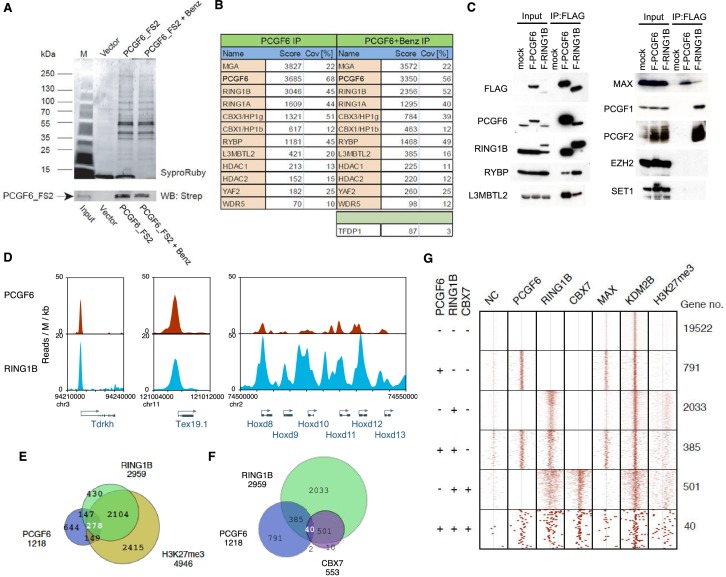
Figure 1. Biochemical properties of PCGF6-PRC1 and its target genes in ESCs.
(A) Affinity purification of PCGF6-containing complexes in ESCs. To purify PCGF6 and associated proteins, a mouse ESC cell line stably expressing Flag-2xStrepII (FS2)-tagged PCGF6 was generated. Nuclear extract was isolated from this cell-line, PCGF6 was affinity purified, and the purified proteins were subjected to mass spectrometry. Purified PCGF6 fractions were resolved by gradient SDS-PAGE and visualized by SyproRuby staining. The purifications were performed in the absence and presence of benzonase (Benz) to exclude DNA-mediated interactions and a cell line containing only the empty vector was used as control for non-specific binding to the affinity matrix. The elutates were probed by western blot for streptavidin (Strep). (B) Identification of proteins that form stable complexes with PCGF6 in ESCs. Elutions from the PCGF6 affinity purification were directly analyzed by tryptic digestion followed by peptide identification by LC-MS/MS. The Mascot scores and peptide coverage are shown for the respective affinity purifications. (C) Confirmation of PCGF6-containing complexes by immunoprecipitation-immunoblot (IP-IB) analysis. Whole-cell extracts (WCE) from ESCs expressing FLAG-tagged PCGF6 or RINGB were subjected to IP using anti-FLAG antibody. The WCE and immunoprecipitates were separated on SDS-PAGE and analyzed by IB with the indicated antibodies. (D) Screenshot views for the distribution of PCGF6 (red) and RING1B (blue) at target genes in ESCs determined by ChIP-seq. The chromosomal positions are indicated on the x-axis. The transcription start sites (TSSs) are denoted by arrows. (E) Venn diagram representation for the overlap of PCGF6, RING1B and H3K27me3 target genes in ESCs identified by ChIP-seq. The number of genes bound by PCGF6, RING1B and H3K27me3 and included in each fraction are indicated. (F) Venn diagram representing the overlap of PCGF6, RING1B and CBX7 target genes. Published ChIP-seq data for CBX7 was obtained from NCBI GEO (accession number GSM1041373). (G) A heat map view for distribution of PCGF6, RING1B, CBX7, MAX, KDM2B and H3K27me3 in ±4 kb genomic regions around transcription start sites (TSS). Genes are classified based on their occupancy by PCGF6, RING1B and CBX7 in ESCs. The signal from a negative control (NC: FLAG-ChIP in mock transfected ESCs) was also shown.
DOI: http://dx.doi.org/10.7554/eLife.21064.002


