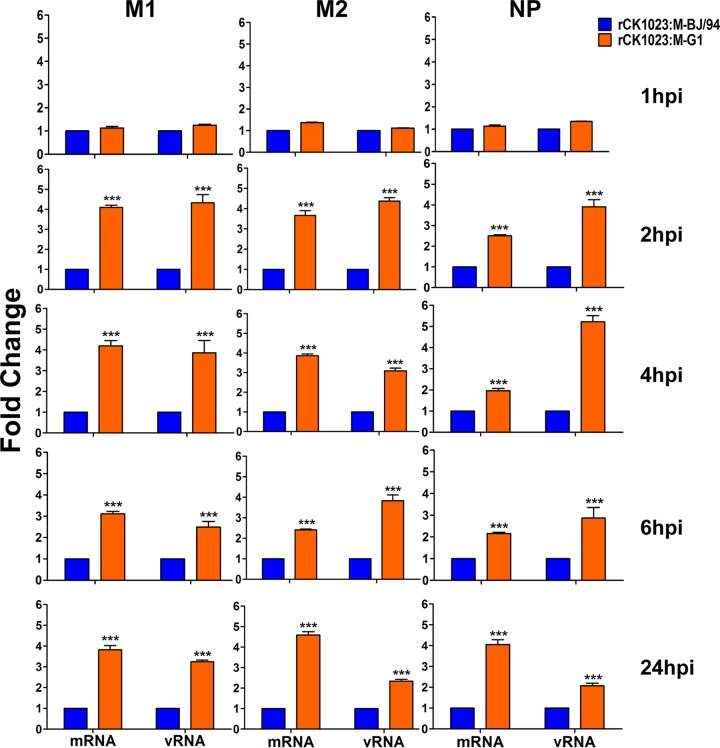
FIG 2.
Relative expression levels of viral M1, M2, and NP mRNAs and vRNA of the rCK1023:M-G1 and rCK1023:M-BJ/94 H9N2 viruses in CEFs. CEFs were infected with the indicated H9N2 viruses at an MOI of 0.01 for 1, 2, 4, and 6 h or at an MOI of 0.001 for 24 h. mRNA and vRNA expression levels are presented as fold changes relative to the values for the rCK1023:M-BJ/94 virus. Data are presented as means ± standard deviations of results from three independent experiments. Statistical significance was based on two-way ANOVA (***, P < 0.001).

