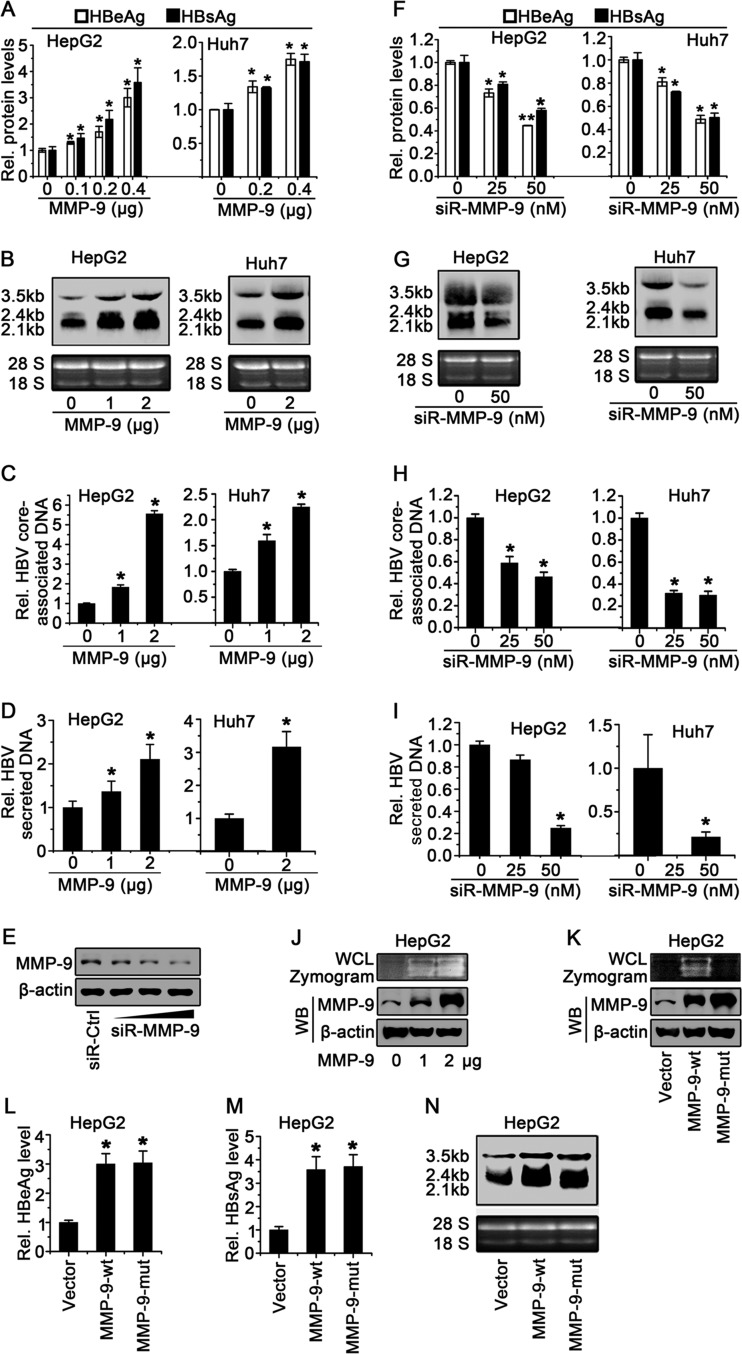
FIG 2.
MMP-9 enhances HBV replication in hepatocytes. (A to D) HepG2 cells (left) and Huh7 cells (right) were cotransfected with pHBV1.3 and pCMV-Tag2B-MMP-9 at different concentrations for 48 h. (A) HBeAg and HBsAg in the supernatants of transfected cells were assayed by an ELISA. (B) HBV RNAs (3.5-kb, 2.4-kb, and 2.1-kb RNAs) were detected by Northern blot analyses, and 18S and 28S rRNAs were used as loading controls. (C and D) Levels of HBV core-associated DNAs in cell cultures (C) or supernatants (D) were measured by qPCR. (E) HepG2 cells were transfected with control siRNA (siR-Ctrl) or siR-MMP-9 at different concentrations for 48 h. Levels of MMP-9 and β-actin proteins expressed in treated cells were determined by Western blot analyses using the corresponding antibodies. (F to I) HepG2 cells (left) and Huh7 cells (right) were cotransfected with pHBV1.3 and siR-MMP-9 at different concentrations for 48 h. (F) HBeAg and HBsAg levels in the supernatants were assayed by an ELISA. (G) HBV RNAs were detected by Northern blot analyses, and 18S and 28S rRNAs were used as loading controls. (H and I) Levels of HBV core-associated DNAs in cell cultures (H) or supernatants (I) were measured by qPCR. (J) HepG2 cells were transfected with pCMV-Tag2B or pCMV-Tag2B-MMP-9 for 48 h. MMP-9 enzyme activity in WCLs was determined by a gelatin zymography assay (top), and the MMP-9 protein level was determined by Western blotting (WB) (bottom). (K) HepG2 cells were transfected with pCMV-Tag2B, pCMV-Tag2B-MMP-9-wt, or pCMV-Tag2B-MMP-9-mut for 48 h. MMP-9 enzyme activity in WCLs was determined by a gelatin zymography assay (top), and the MMP-9 protein level was determined by Western blotting (bottom). (L to N) HepG2 cells were cotransfected with pHBV1.3 and pCMV-Tag2B-MMP-9 or pCMV-Tag2B-MMP-9-mut. (L and M) HBeAg (L) and HBsAg (M) in the supernatants were assayed by an ELISA. (N) HBV RNAs were detected by Northern blot analyses. A total of 5 × 10⁵ cells were used to determine HBeAg/HBsAg expression levels, and 2 × 10⁶ cells were used for analyses of HBV DNA/RNA levels. Results show means ± standard deviations (n = 3). *, P < 0.05; **, P < 0.01.

