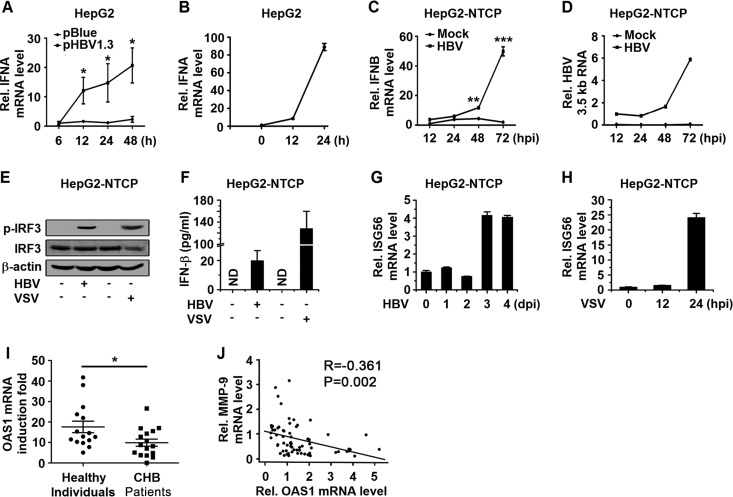
FIG 4.
HBV infection activates type I IFN signaling in HepG2-NTCP cells. (A) HepG2 cells were transfected with pBlue or pHBV1.3 for the indicated times, and the mRNA levels of IFNA were determined by qPCR. (B) HepG2 cells were infected with VSV (MOI = 1) for the indicated times, and the mRNA levels of IFNA were determined by qPCR. (C and D) HepG2-NTCP cells were mock infected or infected with HBV at 1,000 GEq per cell. IFNB mRNA levels (C) and HBV 3.5-kb RNA levels (D) were analyzed by qPCR at the indicated times postinfection. hpi, hours postinfection. (E and F) HepG2-NTCP cells were mock infected or infected with HBV at 1,000 GEq for 6 days or infected with or without VSV at an MOI of 1 for 24 h. (E) Protein levels of p-IRF3, IRF3, and β-actin were determined by Western blotting. (F) Protein levels of IFN-β in the culture supernatants were determined by an ELISA. (G and H) HepG2-NTCP cells were infected with HBV (1,000 GEq) or VSV (MOI = 1) for the indicated times, and ISG56 mRNA levels were measured by qPCR. (I) PBMCs freshly isolated from CHB patients (n = 16) and healthy individuals (n = 15) were stimulated with or without IFN-α (300 U/ml) for 12 h. OAS1 mRNA levels were measured by qPCR. Points represent the fold induction of OAS1 mRNA for each sample. (J) MMP-9 and OAS1 mRNA levels in PBMCs of CHB patients (n = 69) were measured by qPCR, and the correlation of mRNA levels of OAS1 and MMP-9 was analyzed by using SPSS software. Graphs show means ± standard deviations (n = 3). *, P < 0.05; **, P < 0.01; ***, P < 0.001.

