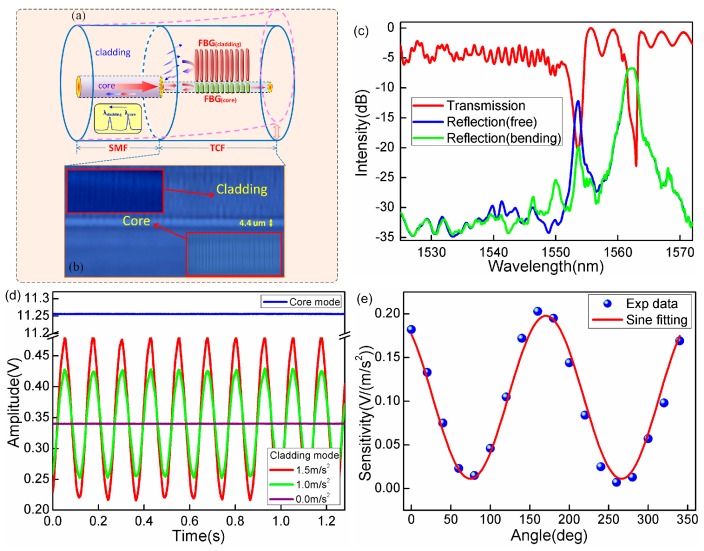
Figure 5.
(a) Schematic diagram of TCF-FBG directional accelerometer; (b) Image of TCF-FBG, insets show the zoomed images of gratings in fiber cladding (up) and fiber core (bottom); (c) The transmission spectrum of TCF-FBG with two well-defined resonances; (d) Real-time power output of cladding mode and core mode (blue curve) under the same vibration condition; (e) Angular dependence of acceleration responsivity of sensor.

