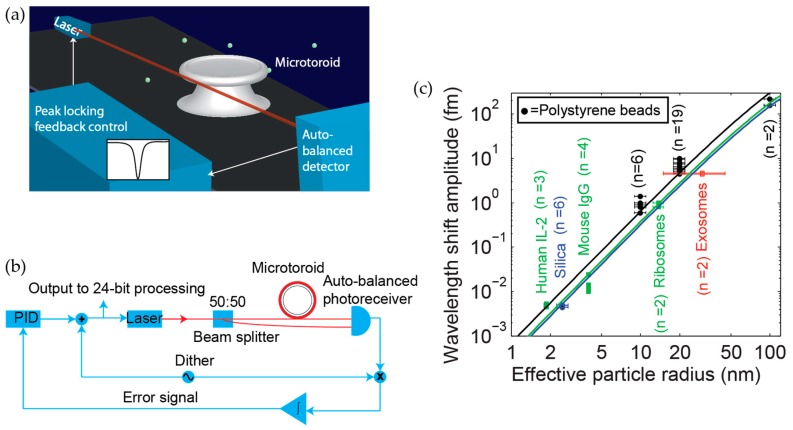
Figure 8.
Overview of FLOWER and summary of particle detection data (a) FLOWER schematic. Frequency locking in combination with auto-balanced detection and data processing techniques have been used to improve the signal-to-noise ratio of microtoroid optical resonators to the extent that single macromolecule detection is possible. Reprinted (adapted) with permission from [16]. Copyright 2015 American Chemical Society; (b) Block diagram of FLOWER. Reproduced from [1]; and (c) Summary of particle detection data acquired using FLOWER. The different colored solid lines are theoretical predictions corresponding to different particle dielectric constants. Reproduced from [1].

