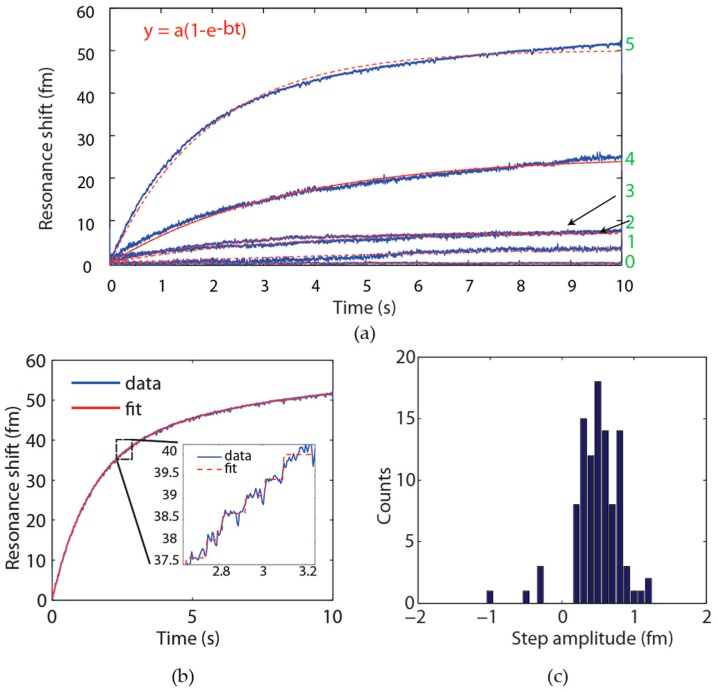
Figure 9.
Exosome detection data obtained using FLOWER (a) Exosome binding curves. Mice were implanted with human Burkitt’s lymphoma tumor cells, and each week blood serum samples were taken and later analyzed all together using FLOWER. The curves shown here are from a single mouse. For each week we see an increase in the response from the sensor corresponding to increasing exosome levels. Weeks are indicated in green. No significant signal was obtained from Week 0. The data traces are fit with a simple exponential (dashed red line) corresponding to first-order kinetics. (b) Zoom-in of Week 5 and corresponding step-fit (red) and (c) histogram of step heights. Individual steps corresponding to the binding of individual exosomes may be seen. Negative step amplitudes represent unbinding events. Reprinted (adapted) with permission from [16]. Copyright 2015 American Chemical Society.

