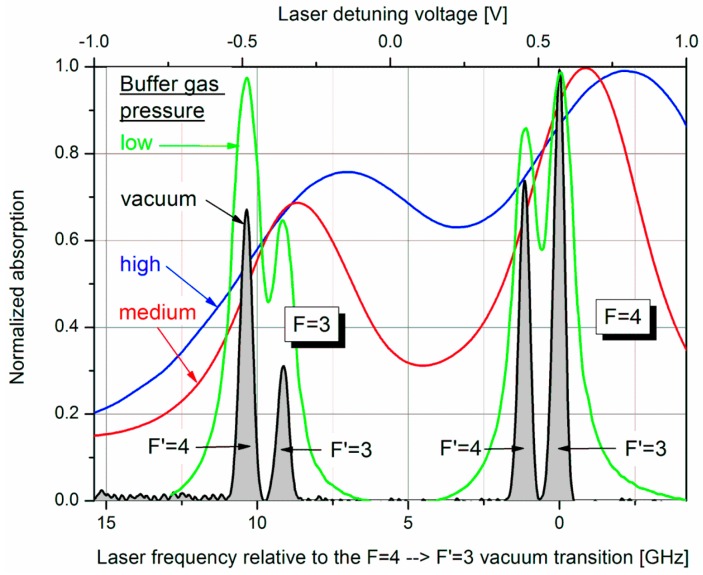
Figure 2.
Absorption spectra of Cs cells with different N2 buffer gas pressure. For the determination of the respective pressure the absorption spectra were fitted by Lorentz profiles. Using the data from Couture [32], broadening as well as shifting of the absorption lines with reference to a vacuum cell delivered consistent values of 20, 125, and 250 mbar at 130 °C for low, medium, and high pressure, respectively. All absorption curves are normalized to their individual maximum.

