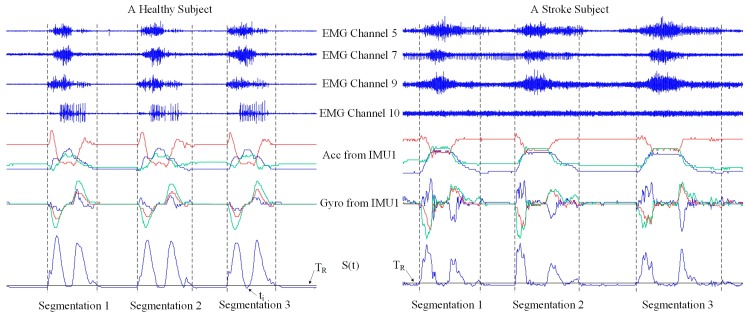
Figure 4.
Illustration of the data segmentation process when representative data channels are used as examples from a healthy subject and a stroke subject performing TASK 8, respectively. For each subject, there are three repetitions of task performance. The black solid line represents the threshold TR.

