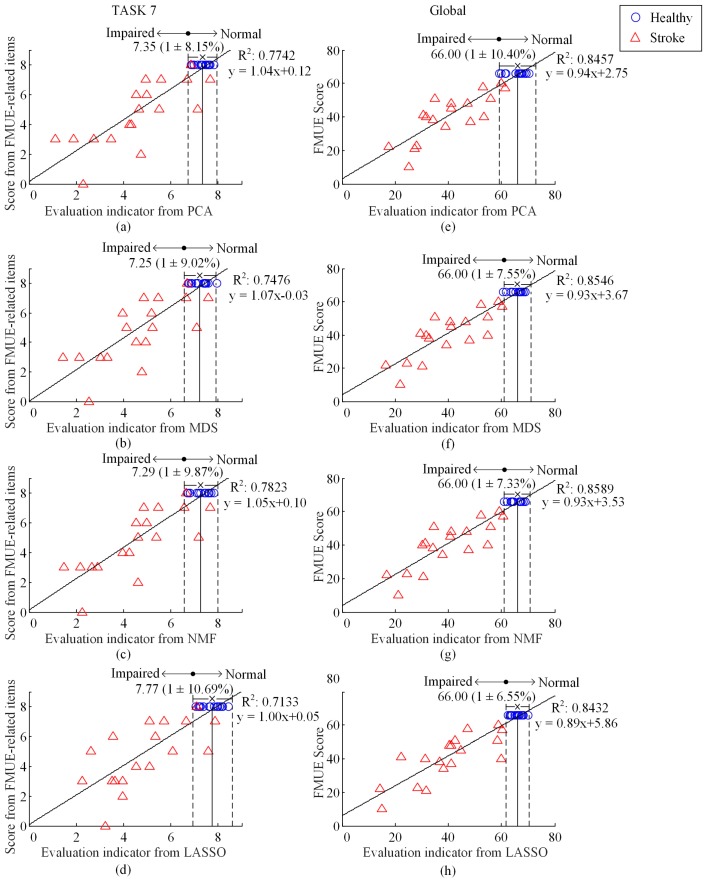
Figure 7.
Plot of score of FMUE-related items versus the EI for TASK 7 (a–d), and plot of FMUE score versus the EI (e–h), using PCA (a,e), MDS (b,f), NMF (c,g), and LASSO (d,h), respectively. All symbols and lines appear in the same way as illustrated in Figure 5.

