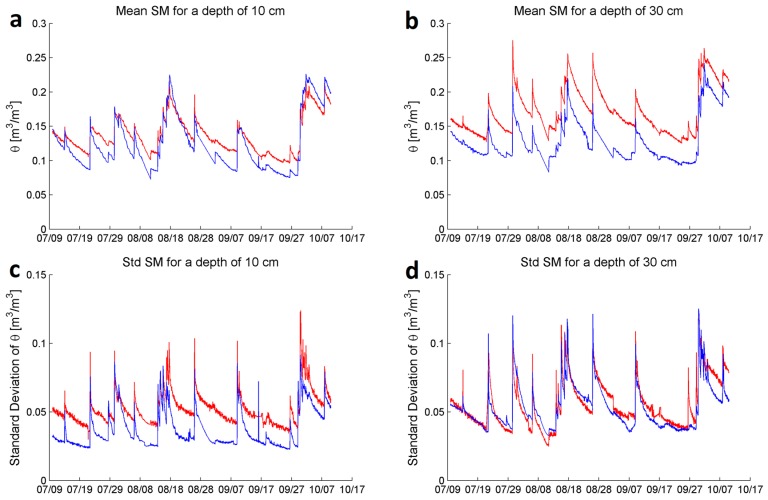
Figure 11.
Comparison of the mean and standard deviation of volumetric soil moisture (SM), in m3·m−3 at sites 2 and 6 in red and blue, respectively, in the ASWP WSN testbed between 10 July and 10 October 2016. (a) Mean SM at a depth of 10 cm; (b) Mean SM at a depth of 30 cm; (c) Standard deviation of the SM at a depth of 10 cm; (d) Standard deviation of the SM at a depth of 30 cm.

