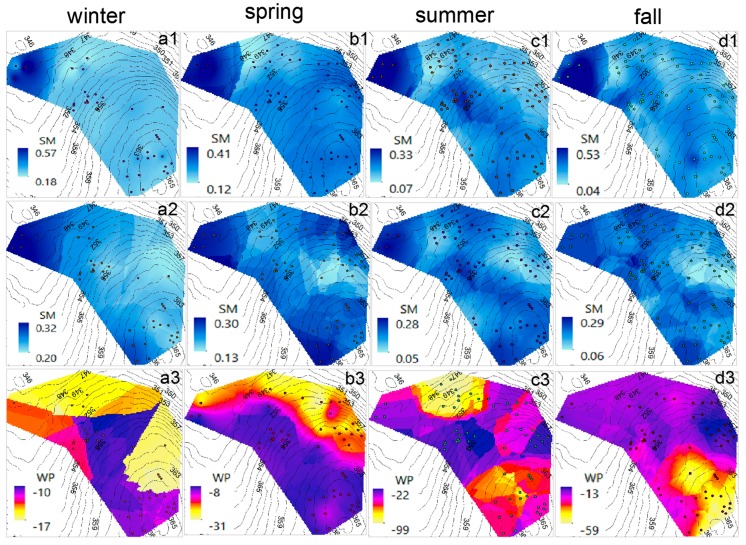
Figure 12.
Interpolated surfaces (Kriging method) showing the average seasonal variation in volumetric soil moisture (SM) and soil water potential (WP), based on data retrieved from 2010 to 2016. (a) winter average (December–February): (a1) SM at 10 cm; (a2) SM at 30 cm; (a3) WP at 30 cm; (b) spring average (March–May): (b1) SM at 10 cm; (b2) SM at 30 cm; (b3) WP at 30 cm; (c) summer average (June–August): (c1) SM at 10 cm; (c2) SM at 30 cm; (c3) WP at 30 cm; (d) fall average (September–November): (d1) SM at 10 cm; (d2) SM at 30 cm; (d3) WP at 30 cm. SM is expressed in m3·m−3. WP is expressed in kPa. The elevation contours are expressed in m. The dots represent the nodes from which the data was retrieved.

