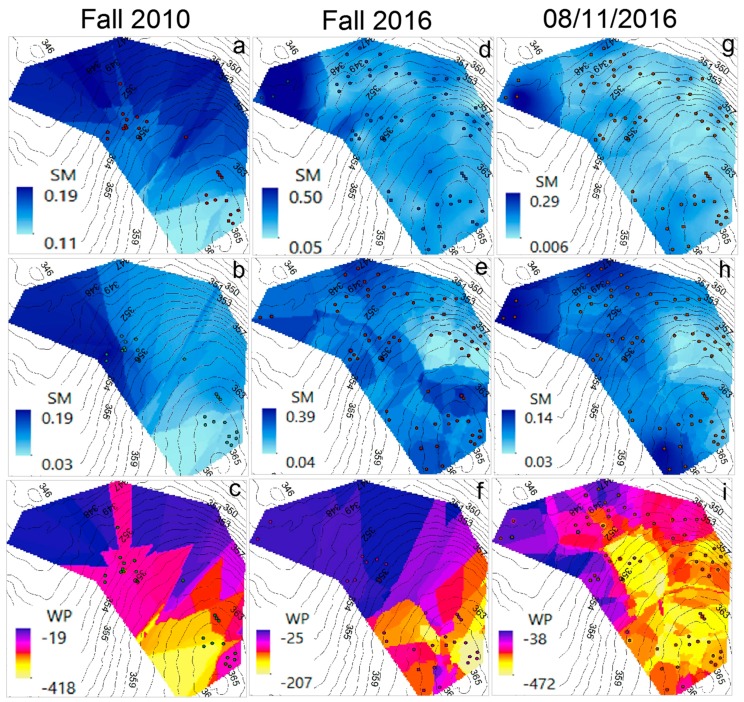
Figure 13.
Interpolated surfaces (Kriging method) showing a comparison between the average fall (September–November) SM and WP of 2010 and 2016, and average SM and WP on 11 August 2016 (08/11/2016). (a) SM at 10 cm (fall 2010); (b) SM at 30 cm (fall 2010); (c) WP at 30 cm (fall 2010); (d) SM at 10 cm (fall 2016); (e) SM at 30 cm (fall 2016); (f) WP at 30 cm (fall 2016); (g) SM at 10 cm (11 August 2016); (h) SM at 30 cm (11 August 2016); (i) WP at 30 cm (11 August 2016). SM is expressed in m3·m−3. WP is expressed in kPa. The elevation contours are expressed in m. The dots represent the nodes from which the data was retrieved

