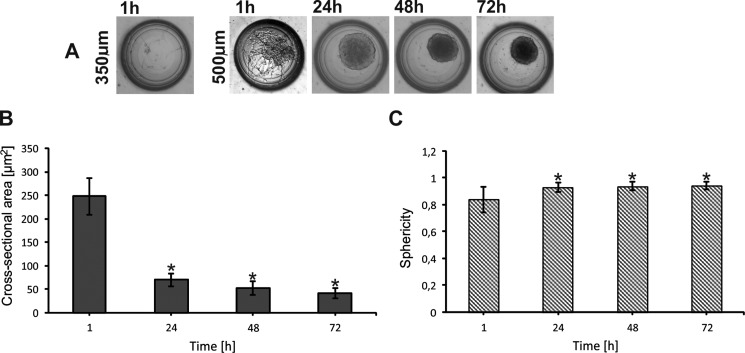
FIG. 3.
MRC-5 cell aggregation. (a) Microwells (500 and 350 μm) with MC culture. (b) Changes of the cross-sectional area during MRC-5 cell culture. (c) Changes of sphericity during MRC5 cell culture. Error bars are calculated as the standard deviation of the spheroid population. The reference values for the statistical analysis are the results obtained 1 h after cell introduction. Asterisks indicate p < 0.05.

