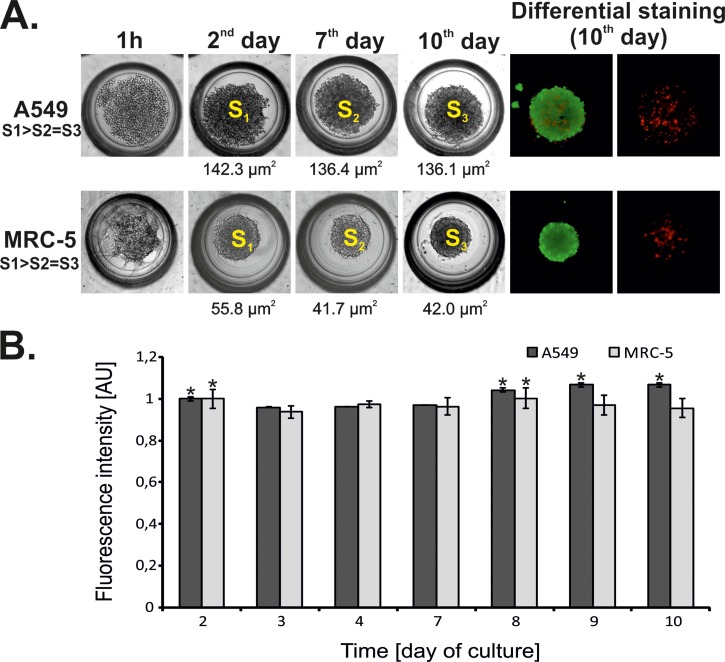
FIG. 7.
(a) MRC-5 and (b) A549 aggregation and viability depending on a flow rate of the introduced cell suspensions. Tests performed in the microsystem with microwells with a depth of 500 μm. A suspension of (a) MRC5 cells without collagen. (b) A549 cells with collagen. Green objects are the life cells/spheroids (stained with Calcein AM) Red objects are the dead cells/spheroids (stained with Propidium iodide). (c) Spectrofluorimetric measurement of A549 and MRC-5 spheroid viability. The bars of the fluorescence intensity were normalized to 1. The reference values for statistical analysis are the results obtained for 10 μl min−1. Asterisks indicate p < 0.05.

