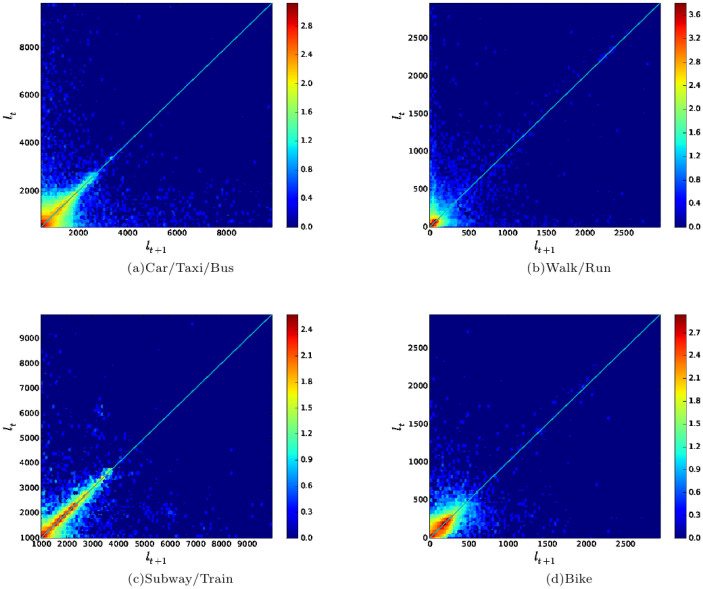
Figure 4. Flight length correlation for each transportation mode.
(a–d) Consecutive Flight length correlation of all transportation modes (Car/Taxi/Bus, Walk/Run, Subway/Train, Bike) in the GeoLife dataset. A high density of points are near diagonal line lt = lt + 1, identifying a small difference lt+1 − lt in the same transportation mode between two time steps.

